

|
educational blogs |
|
I am writing this on a Saturday night cos tomorrow I need to go down to Swindon to visit my Father who is in Hospital and at 87 with considerable Health Issues it looks like the clock is ticking. I expect to be travelling to see him quite a bit in coming weeks so my time for updating the Website will be under pressure - I will do what I can and concentrate on the Trading side of things rather than the Educational stuff. Don’t worry, I’m not disappearing or anything and as soon as things settle down I will resume normal scribblings.
Next week is all about the US Election obviously and my focus is very much on this. I won’t bother giving the Almanac figures for the coming week as I can’t see they have much relevance in the circumstances - however, it is worth noting that in the Bigger Picture we are now entering into the strongest period of the year and November tends to be a good month - so partly for these reasons I am keen to be as near as I can get to 100% Long Stocks as soon as I can.
Regular sufferers of my various updates will know I have been battling against some ‘unfortunate’ Index Short Positions for most of this year which I placed to Hedge my Share Portfolio against a variety of Major Events which were coming up. As things turned out, these Hedges have been a thorn in my side and I have been putting a lot of thought into how I can improve in the future - I have no doubt that Hedging is a vital Weapon in the Armoury and the issues I have are around the application of Hedging, not the Principle. To get a view of the grief the Shorts have caused me this year, check this Blog out:
http://wheeliedealer.weebly.com/blog/the-price-of-caution Anyway, the Week just gone has improved the situation for my Portfolio massively with a gain of 2.2% across everything in a Week when Major Indexes fell a lot - this has got me much nearer to sorting the mess out and maybe I have a chance of recovering things by the Year End if I can get my Shorts off and get as close to Fully Long as possible. Current Plan for the Coming Week I am really pleased with how things are developing on the Markets. If you think back to the Brexit Vote, Markets actually rose in the days prior to the Result obviously on the pure anticipation that ‘Remain’ would win and things would carry on as normal. Things are very different with this US Vote - and in a really good way I think. I remember having a Plan for the Brexit lead-up and one of the key elements was that I expected the Markets to fall due to the uncertainty so that they would Rally on the Result - in the event this did not happen at all. However, for this Vote, Markets have already had a big Sell-off in the last week and are now a long way off their Peaks. My suspicion is that Market Participants really understand just how close this Election is and that there is a very real possibility that Trump will win - and this is generally seen as a major negative for Stocks - partly of course because Billary is the Wall Street Candidate (and funded by them for good measure). In reality I suspect a Clinton win will mean a Rally on Wednesday and a Trump win might mean perhaps a small bit of downside but it will quickly reverse - we might even Rally on a Trump win as so much of the negativity has already been priced-in and the simple truth is that the Loon won’t be in the White House until January and he will be hugely constrained by Congress and the Senate anyway. As with Obama, I suspect many Voters would be hugely disappointed by what Trump is actually able to do if he does become the 45th President. As ever, I am not too focused on the ‘News’ and the ‘Noise’ around the Election - what really matters and what will drive my Trading will be what the Charts and various Indicators are telling me - Regular Readers will know my preferred Technical Tools and I will be particularly looking for Reversal Signals on the Daily Candlesticks and the RSI (Relative Strength Index) will be particularly useful. My current thinking is that I will look very closely at the Charts on Monday Night and may well Close out some FTSE100 and Nasdaq 100 Short Positions - one of the joys of Spreadbets with igIndex is that I can do these ‘Out of Hours’ and I find this very useful sometimes. I am also thinking of Closing a small XUKS FTSE100 Short ETF that I have in my ISA and using the Cash freed up to topup on a few Stocks - we shall see - I will make any decisions around this on Monday Night and execute the Trades on Tuesday. With my Topups I am not overly keen to buy more Stocks of a cyclical nature - I might go for some more GFRD but otherwise I will try to go for things with more of a defensive bent - having said that, I do fancy more MOSB as I don’t have much. I think we are very late in the Economic Cycle and we might see a Slowdown or even Recession in 2017 or soon after. I am toying with the idea of keeping a bit of my FTSE100 Shorts open in case ‘Drain the Swamp’ Donald does win - this would give me a little protection for Wednesday etc. but maybe I should close everything out. It depends largely on what happens on Monday and Tuesday - if Markets fall more, then I will be more inclined to Close the Shorts as more and more negativity gets priced-in. I am happy to buy some real Shares before the Vote but I am reluctant to take on more Leverage - however, as I have mentioned before, I quite fancy the idea of placing an Index Long via a Spreadbet to take advantage of a Bounce off the Bottom - such rebounds can make you big money very fast and are relatively low risk as the Bad News has already been had. My current thoughts are that I will look at the Charts on Wednesday Night and Thursday Night and if I see clear signs of the rebound being underway, I will put a Long on something like the S&P500. This would be a short term trade of maybe even just a few days to take advantage of any bounce. That’s how things look now on Saturday night - obviously it is a fluid Plan and I will adjust as I need to with most of the Decisions being made on Monday Night. As ever, I will no doubt be tweeting out anything I do. OK, let’s see how the Charts currently line up with my Plan…… FTSE100 As always, the Charts are straight ScreenShots from the wunderbar ShareScope software that I use as my ‘Workbench’. Due to the focus on next week’s events, I will concentrate on Short Term Indicators here. The Chart below has the Daily Candles for the FTSE100 going back about 4 Months. Let’s start off with the Red Arrow which is pointing to the Red Line which marks the Long Term (6 years) Uptrend Channel Bottom Line which is extremely important. We managed to get over this Line for a very brief period of time in early October but we then fell back below and we are now some way off it. This Line is so important because it represents Long Term Resistance and the FTSE100 must get above it if we are really going to go higher and take out the New All Time High at 7130 - with the failure to stay above this level, I suggest we might be a long time from getting over 7130 and I think it is pretty unlikely even during the historically strong Winter Period - this is especially the case if the Pound continues to strengthen - quite likely. The Blue Arrow is pointing to a Downtrend Line that comes from the Peaks in 2015 - if you look through some of my previous Weekly Chart Blogs you will be able to see how this line and the Red Line are formed but I will not repeat them here now for time reasons. This Blue Line is now acting as Resistance again and the 50 Day Moving Average (the Dark Blue Wavy Line) is also an area of Resistance just below the Blue Line - so really we need to see the FTSE100 over about 6950 to get confident that these Resistance Levels can be beaten. Next look at the Black Arrow - this is pointing to the 200 Day Moving Average (the light Blue Wavy Line) - this is at about 6450 and if we do see a further drop down on the FTSE100, this will be an important Support Level to watch. My Green Arrow is pointing to a Support Level from back in mid September at 6654 - this is the Key Support now and if this fails in the next couple of days, then we may go lower. My Yellow Circle is marking out an Ugly Big Red Down Candle from Friday 4th November - such things are never what you want to see and it suggests more downside - note also that the US Markets turned down late in the day and this might be a lead for the FTSE100 to follow on Monday. If 6654 fails then I guess we will take a visit to 6600 at least (God, I would love this as it would help sort out my Shorts !!) Note how the last 5 Candles have shown an ‘acceleration’ to the Downside - this suggests to me that much of the Fall has been done already. 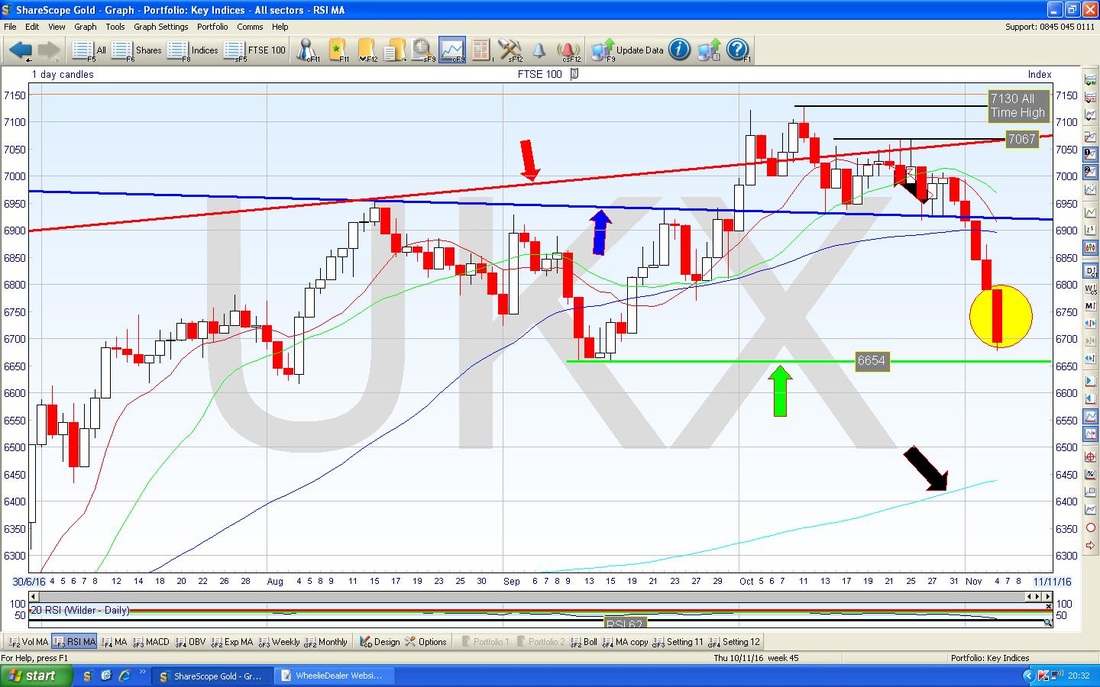
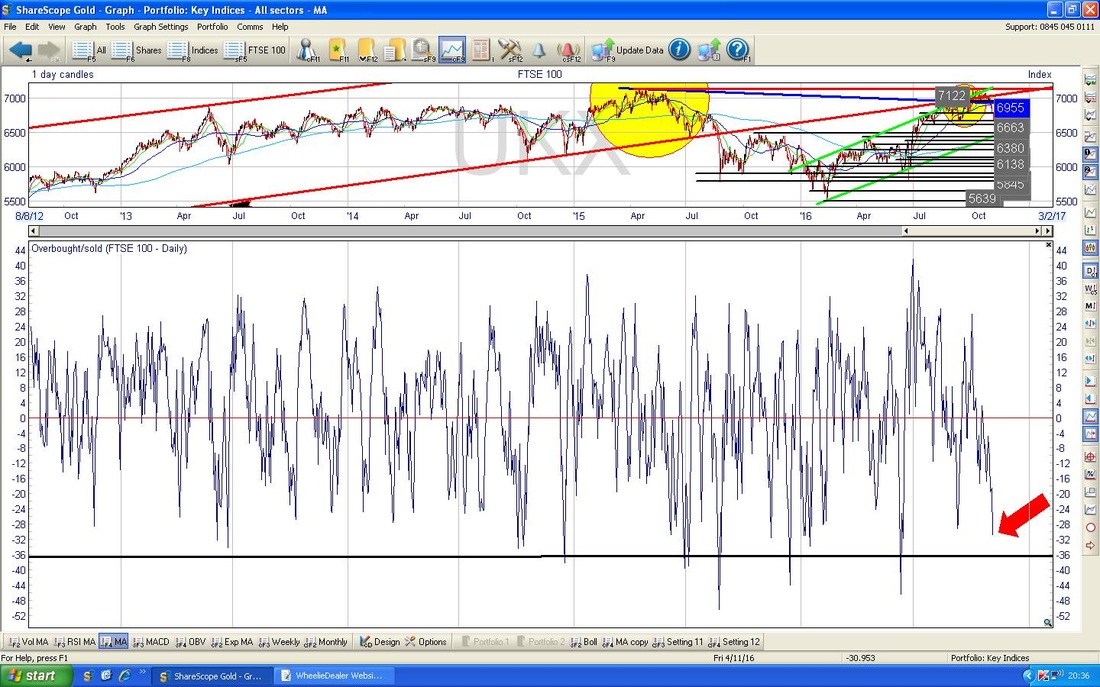
In the bottom window below we have the ‘Overbought / Oversold’ Indicator - I utterly love this as it is excellent for Short Term timing - the only slight catch (and I don’t understand why this is the case) is that ShareScope only has it for the FTSE100 (I use the ‘cheap’ End of Day ShareScope version - maybe on the more advanced ones you can get it for more Assets). If you look at my Red Arrow you can see that the Indicator is really low - this suggests we are due a bounce very soon.
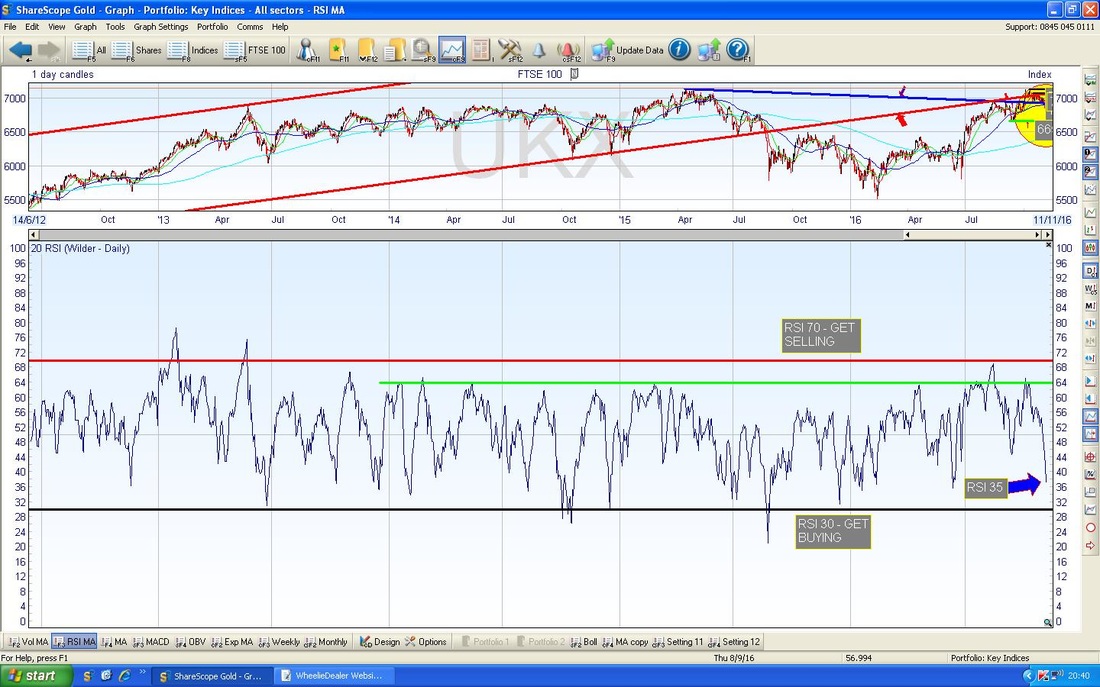
In the bottom window below we have the RSI (Relative Strength Index) for the FTSE100 Daily. My Blue Arrow shows where we are now with an RSI of about 35 - this is a low reading as you can see but I reckon we could go a bit lower before the Bounce - let’s see how this reading changes at the Close on Monday Night.
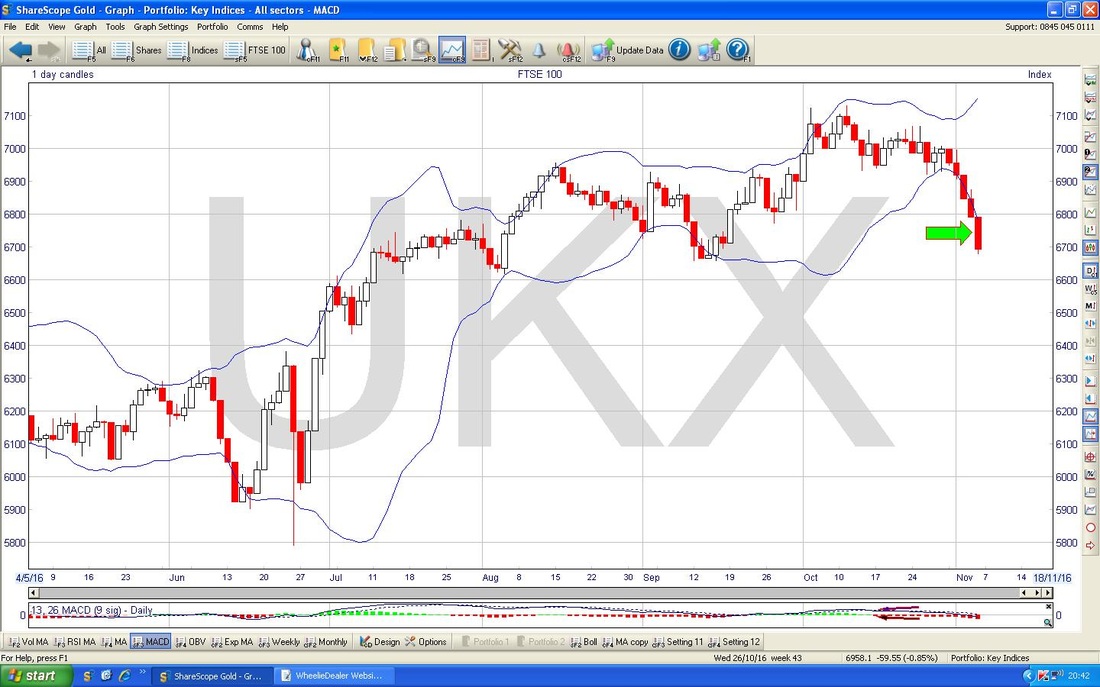
The Screen below has the Daily Price Candles for FTSE100 surrounded by the Blue Wiggly Bollinger Bands for just a short period. My Green Arrow is pointing to the Candle from Friday - note how it is ‘outside’ the Bollie Bands - this is an unstable situation and it needs to get back inside the Bands - this means we may not get much more downside and we could Bounce or go Sideways very soon.
S&P500
The Chart below has the Daily Candles for the S&P500 going back about nearly 6 months. My Red Arrow points to an ‘Inverted Hammer’ Candle from Friday and in the context of the move down for many Days before, this might be telling us the Market will move up soon. However, it is not a great Signal - ideally we would get a ‘Normal’ Hammer with a Long Tail pointing downwards - maybe we will see one soon. My Blue Arrow is pointing at the Light Blue Wavy Line which is the 200 Day Moving Average - note we are very near that now around 2085 and we might find Support around here. My Black Arrow is pointing to the 50 Day Moving Average Line (the Darker Blue Wavy Line) - note this has turned downwards and suggests we are in a Downtrend phase for a bit. There is a lot of Resistance now up above the Price at 2120 upwards - this might limit any Bounce we do see. To the Downside, if we fall more, we should see Support between about 2040 to 2060. 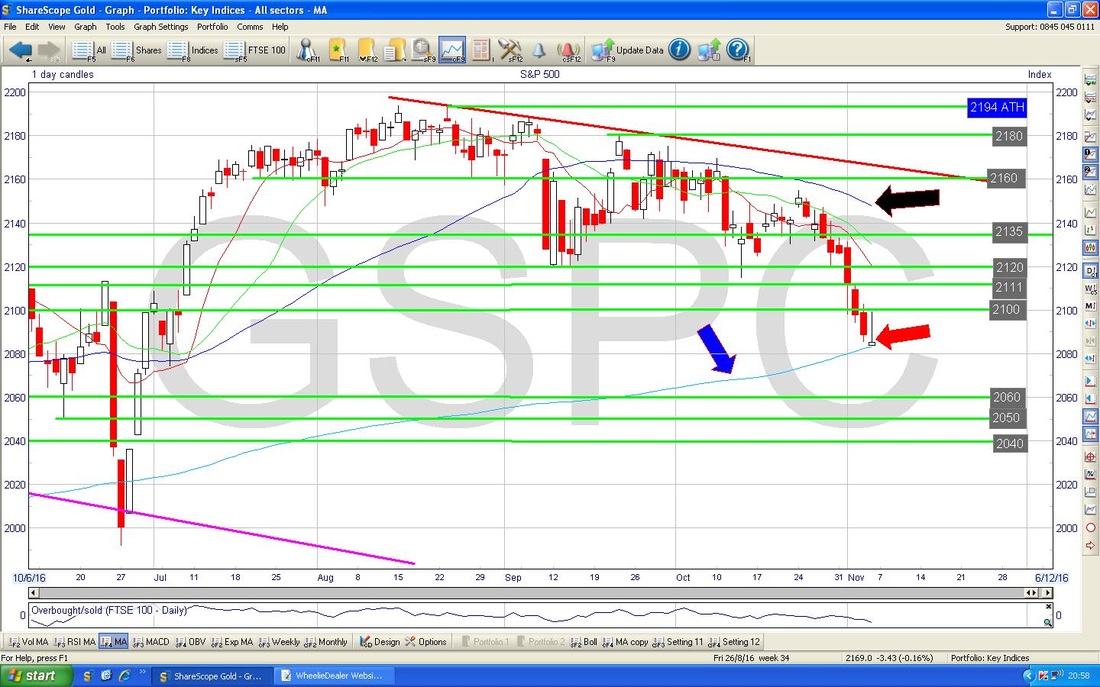
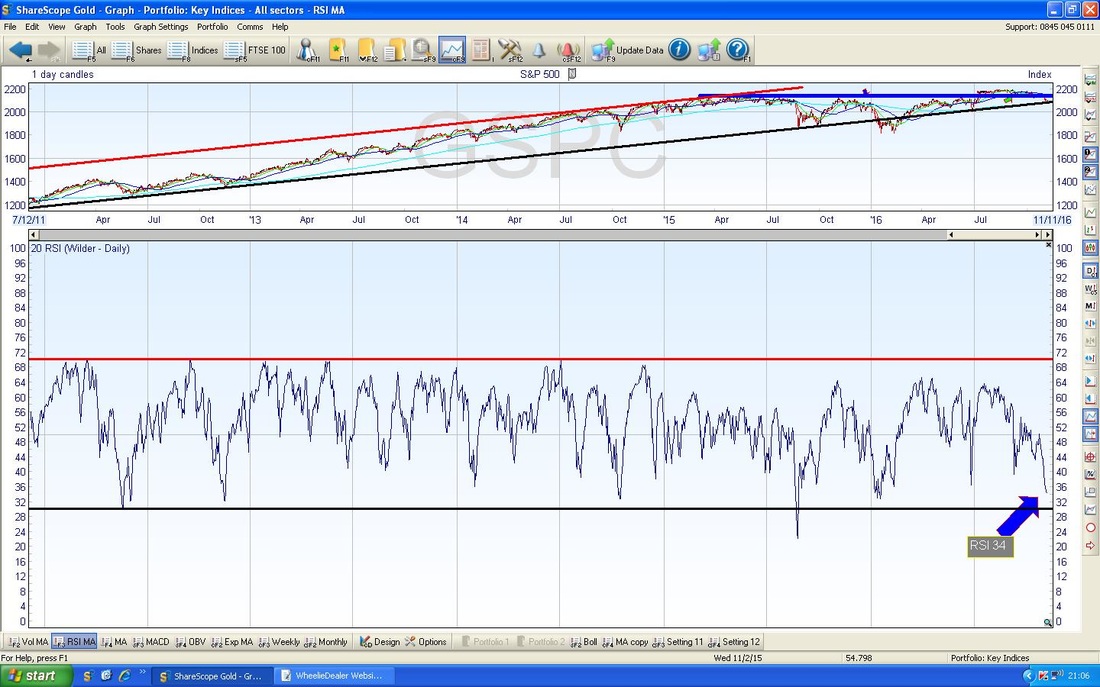
In the bottom window below we have the RSI for the S&P500 Daily - with a reading of RSI 34 this is getting very low - we can go a bit lower, but not much I reckon.
Nasdaq 100
This has particular relevance for me because I have a Short Position on this Index - it is like the Nasdaq Composite but different !! Below we have the Daily Candles going back about 6 months. The Yellow Circle highlights an Inverted Hammer that we got on Friday - just like on the S&P500. The same comments apply but note how the Support at 4656 failed - this in itself suggests we might get a little more downside. My Black Arrow is pointing to the 200 Day Moving Average at about 4550 - this could be important Support in coming Days. As with the S&P500, there is now a lot of Resistance up above to wade through. 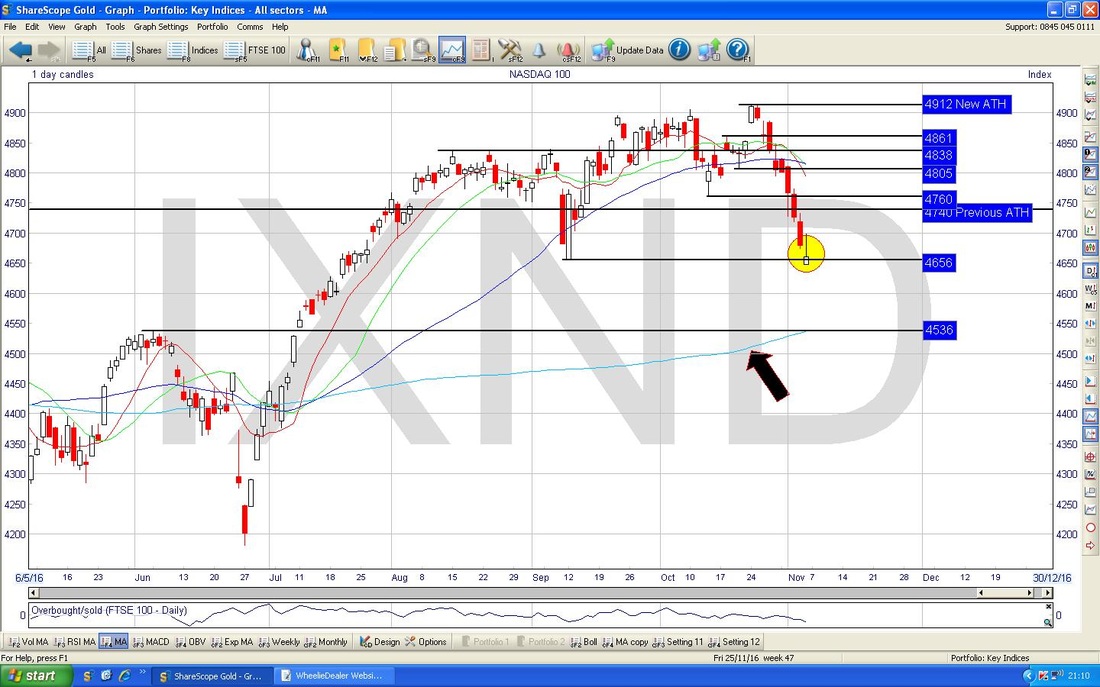
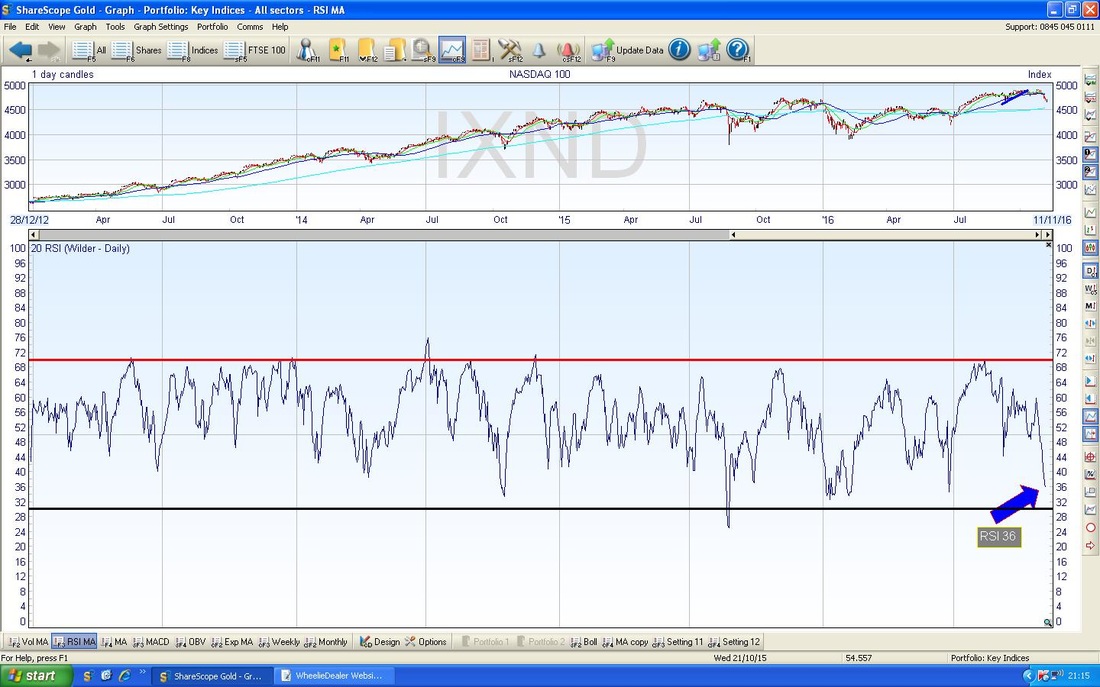
In the bottom window below we have the RSI for the Nasdaq 100. You know the drill by now - with a reading of RSI 36 this is pretty low but we might get a little more downside before a Bounce.
Pound / Dollar
There were some interesting and important moves here last week. I was very worried that we were forming a Sideways ‘Ledge’ where a Price falls heavily and then goes Sideways for a while (forming the Ledge) and then drops headily again. As it turns out, the decisive move up over 1.2333 ish makes me pretty sure we will not see this Ledge thing play out but rather than continuing up, we might just get a wider Range now but it does look like the worst is behind us. If we see more strength from the Pound, then this might be bad for the FTSE100. 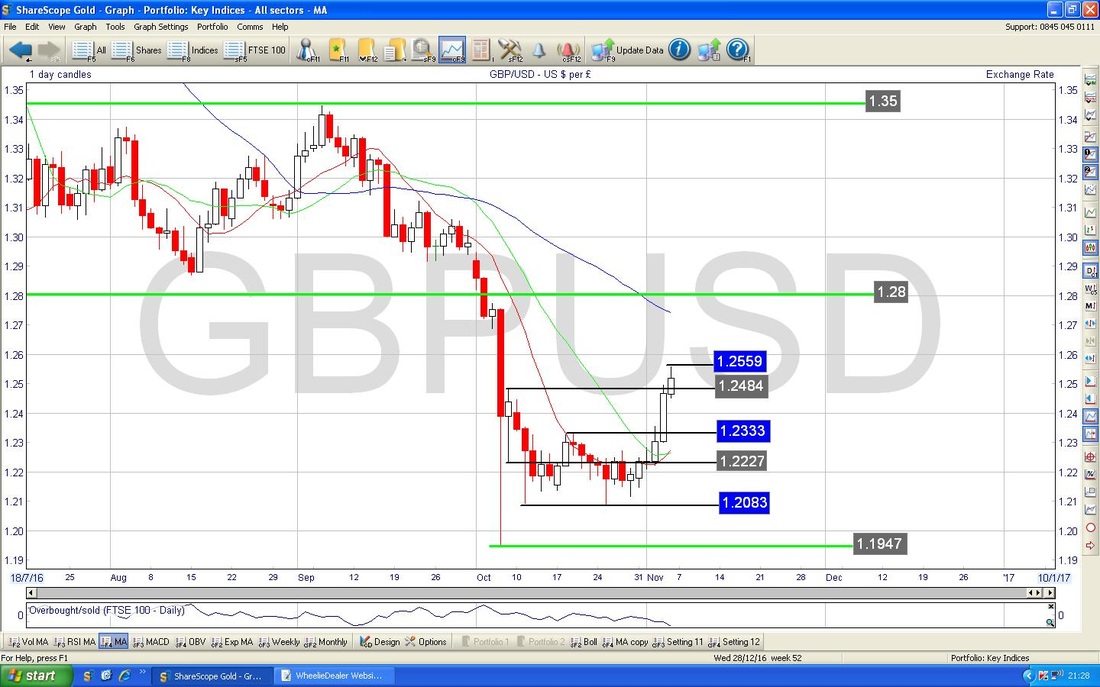
Brent Crude Oil (Spot)
The chart below has the Daily Candles for Brent Oil (Spot) going back about 6 months. My Yellow Circle highlights the Candle from Friday and this was pretty much a down day although it did manage to find Support at around $45. My Green Arrow is pointing to the 200 Day Moving Average and this seems to be acting as Support also. I am wondering if we will now get a wide Range between about $45 at the bottom and $53 at the Top - these are the Blue Text Boxes. Note we have had a lot of Down Days recently - it certainly looks like a Bounce of some sort is due soon. Note the 50 Day Moving Average is heading towards the 200 Day Moving Average - if these cross over, then that would be bad as we would get a ‘Death Cross’ - we are some way off this but it is something to be aware of and to monitor. 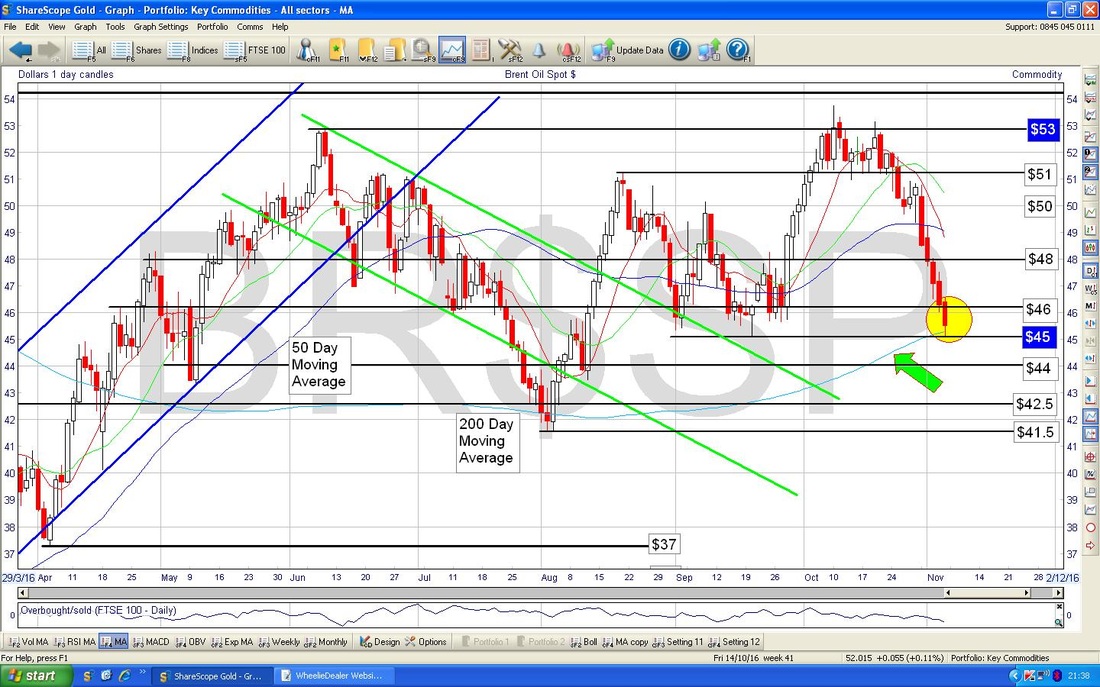
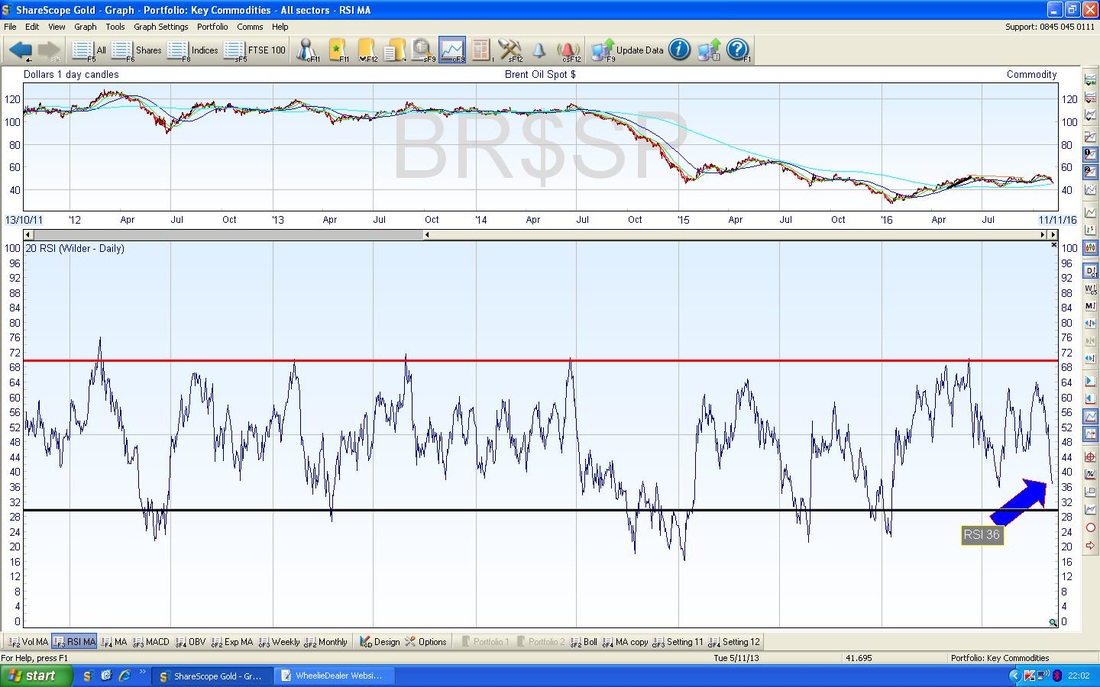
The bottom window below has the RSI - with a reading of RSI 36 it is getting low but note how Brent Oil often has gone much lower and even down to RSI 16 ish - although I suspect this was pretty unusual.
Gold (Spot)
The Chart below has the Daily Candles for Gold going back 7 Months - my Red Arrow is pointing to the ‘Long Tails Doji’ sort of Candle produced on Friday and this shows hesitation after the move up in recent Days. Note the failure to get over $1308 - this level must be taken out. Note also that the Price is currently around the 50 Day Moving Average (the Darker Blue Wavy Line). Up above we have Resistance from the Black Line (marked with the Black Arrow) - this could be a challenge if the Price gets up around $1325 - we need a clear Breakout of this Line. Also look at the Blue Parallel Lines which seem to be marking a pretty wide Uptrend Channel - it will be important to see if this holds true in coming Weeks/Months. That’s it for now - Good Luck in what could be an entertaining Week Ahead. Cheers, WD. 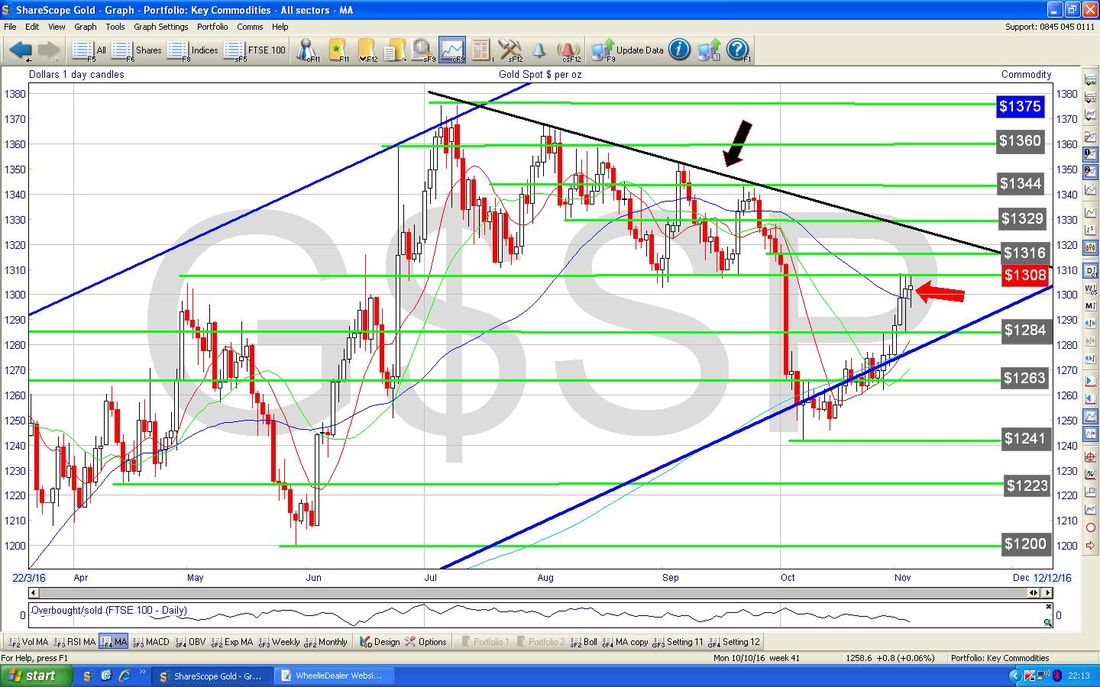
0 Comments
Leave a Reply. |
'Educational' WheelieBlogsWelcome to my Educational Blog Page - I have another 'Stocks & Markets' Blog Page which you can access via a Button on the top of the Homepage. Archives
January 2021
Categories
All
Please see the Full Range of Book Ideas in Wheelie's Bookshop.
|
