

|
educational blogs |
|
It is most definitely a ‘drawback’ (High Class Problem, more like !!) of not doing a ‘Real Job’ that Bank Holidays tend to catch me totally by surprise and I had not realised we have one this Weekend until some point yesterday. That of course means I have more time than usual to write a Charts Blog but my intention as I start scribbling is to get it finished Sunday Night rather than having it drop into Monday as well.
I am currently reading ‘A Man on the Moon’ by Andrew Chaiken and have nearly finished it but probably because of this sort of coincidence, I picked up with special attention that Alan Bean who was one of just 12 Men who walked on the Moon in the period 1969 to 1972, had sadly passed on to the Heavens (he was on the Crew of Apollo 12 which was the one that got hit twice by Lightning just after Launch and for some rather worrying minutes had no Computer whatsoever until they figured out how to reboot it).
Obviously the Death of anyone (apart from Despots, Serial Killers, etc.) is a Sad Event and at least ‘Beano’ had a long life but it is apparent that we really are getting to the end of the Astronauts who were involved in the ‘Race to the Moon’ in all the Missions from Alan Shepherd who was the first Yank in Space through the Mercury one-man Missions, to the two-man Gemini Missions and finally the three-man Apollo Missions which finally culminated with 6 successful trips to the Moon (and of course the disaster but amazing recovery that was Apollo 13).
I am very much a Child of my Time and being born in 1965 I was really too young to notice Apollo 11 do the first Lunar Landing but I remember the later Missions and in particular Apollo 17 which was a remarkable three-day stay on the Moon and for the first time a Scientist rather than a Pilot was involved (Harrison Schmidt who was a Geologist). The really sad bit is that it all seems so long ago. Since those times when the Cold War was in full swing and America was a pretty prosperous place and there was very much a drive to prove that the Free Market system was far superior to the Communist USSR, the realities of various demands for Public Money have meant that it is hard to imagine anything like the Moon Missions happening again - and to be fair I am not sure there is much point anyway unless Energy can be harnessed in Space or something or maybe Minerals on the Moon etc are exploited. It seems like an immense amount of Dosh would be needed and the Payback would probably not be attractive to a Commercial Enterprise. At the moment there seems to be a drive for Space Tourism but I am not convinced by this at all. To my mind Space Flight is by its nature a very dangerous activity and I stuggle to see how a Commercial Tourism venture could really work because once the inevitable disaster happens (and bear in mind the Virgin thing fell apart pretty spectacularly), no one will want to fly and no Insurance Company would be interested. Killing your Customers tends not to be a great Business Model. Then of course we have good old Musky and his SpaceX ‘business’ - like anything the Naked Emperor is involved in its all very technologically bleeding edge and truly remarkable but of course none of it makes any money. I am very much of the view that Tesla etc. is simply an Enron in the making and once we get the next Recession all the Skeletons will emerge - Loss-making Businesses are all well and good until you get to the End of the Road…….Bung me a few Billion Dollars with no proper accountability and I will be an amazing Visionary for you until the Money dries up. With the Space Shuttle a thing of the past and Politicians who are driven not by what they believe but by what gets them Elected in the Short Term, it is hard to see Space being explored more and any visits even to the Moon again seem highly unlikely. With all the modern Bureaucracy and ‘Health and Safety’ attitude we probably wouldn’t be able to do it anyway. No doubt the Spaceship would be stuffed full of IT and that would crash and screw up the Mission. Maybe the future of Space Exploration for Humankind is Chinese and/or Indian…… Last Week My Portfolio bled a mere 0.1% overall Last Week which I guess is better than a big drop but it means I have had two tedious Weeks on the bounce where not much has happened. Fortunately my Portfolio is still up near its All Time Highs and I am quite happy with how things are going, but I always find Sideways moves very grinding and frustrating. On the basis of ‘Third Time Lucky’ perhaps next Week will be better, but of course it is a Short Week with the Bank Holiday and could be choppy. On Friday we have the US Non-Farm Payroll Numbers which usually cause some activity on Friday Afternoon after they come out at 1.30pm UK time. I also am probably going to take a bit of a hit from Air Partner AIR which was involved in those Flight Cancellations for Football Fans who were due to be flying to Europe somewhere to see their team get hammered. AIR is a very illiquid Stock and after the recent Accounting Problems they had I suspect it will get whacked on Tuesday - I am not going to panic though as I doubt it will have any great lasting impact on the business and the story I saw seemed to suggest that AIR had offered alternative Flights which was contradicted by the Travel Agent involved - I expect an RNS Statement from AIR on Tuesday Morning. According to the Investors Chronicle AIR is due to report Final Results on Thursday. Before a couple of specific Macro concerns I’ll just highlight that there appears a common thread at the moment that the Global Economic Growth that we saw a few Months ago is starting to falter and I don’t see it as something to panic about now but we need to keep a wary eye on how things develop. The UK clearly has its own problems around Brexit Uncertainty and a gyrating currency but Europe seems to be slowing as well and even the US might be struggling to keep up the faster Growth Rate we had seen. It is unclear what a Slowdown will mean though - it is very possible that the Markets will like it because it may delay Interest Rate Rises although if it goes too far and becomes a full blown Recession then that would obviously be a huge problem. There is no sign of that yet. Brexit/Italy It has been a while since we had some huge Macroeconomic Worries to fret about but it looks like the ongoing Brexit mess and the recent new Government in Italy could cause some trouble down the track. The Brexit thing is a particular concern and probably much more immediate because the way things are going it seems very possible that we might be facing another General Election soon - maybe in the Autumn. I am so bored with this subject but the nub of it is that the Remain Cohort of MPs (backed up by their Unelected Buddies in the House of Lords) have engineered a situation where Theresa May simply doesn’t have the Votes in Parliament to ensure she can win a Majority for the kind of Brexit she is trying to achieve (and even this is a quite watered-down form of the Brexit that Leave Voters scribbled their Cross for). Staying in the Customs Union and/or the Single Market is simply not Brexit as Leave Voters thought they would be getting. It is by far the Worst of all Possible Worlds and if that is to be the Outcome then we should forget the whole thing and stay in the EU as it is today. Of course this deceit that we can remain in the Customs Union/Single Market and still have Brexit has fired up the Euro-Sceptic wing of the Tory Party and unless Theresa May can perform some sort of weird miracle, it is hard to see how they will not move against her and get the 50 Letters together that are needed to cause a Leadership Election in the Tory Party - and if that happens, then you can gurantee a General Election will be not far behind because a New Leader with more Euro-Sceptic leanings will want to get more MPs so he/she has the Numbers in Parliament to ensure they can get any Votes on Proper Brexit through. What a mess. Next up we have Italy which has somehow managed to create a Government that has both the ‘Far Right’ and the ‘Far Left’ in it. They might seem like polar opposites but the common Policy is that they want more Government Spending and Lower Taxes and the most hilariously nuts idea is a ‘Universal Basic Income’ which is just beyond ridiculous when you have a stagnating Economy and a Debt Mountain which continues to grow. Of course the problem is that there is no way the EU will go along with this and I struggle to see how these kinds of Policies which the Italian Electorate has demanded can be sustained whilst being part of the Eurozone. In the past Italy could do crazy things with its Fiscal Policy because it had the Lira and just did plenty of Devaluations. And I haven’t even mentioned the Mass Deportations that the new Government is promising which of course will upset the EU Elites. So at some point it seems higly likely we will have another Eurozone Crisis and italy will leave the Euro - this is probably not a worry for 2018 but maybe in 2019 the feathers will start flying - and if Italy leaves the Euro there is no way the UK can escape unscathed. In light of the pending disaster that is coming along from Italy, maybe the UK would be best served to stay in the EU on the current arrangements for a few Years because the EU will implode anyway. STOP PRESS - literally as I have been uploading this Blog to the Website I have just seen Sky News which is saying that the Far Right/Left Coalition has been unable to form a Government so it looks like the chaos has already started !!! Strategy I am totally in ‘Summer Mode’ now and trying to do as little as I can with regards to my Stocks and I am just letting things tick over. I am generally happy with my Stocks with the odd exceptions but I am in no mood to increase my Long Exposure (in fact I sold a third of my Long Spreadbet Position on Shell RDSB the other day because I wanted to reduce my Risk after a big move up) and I am more likely to sit on Cash at the moment than to deploy it much. However, there is an exception in that I have still got about £4000 parked in my Income Portfolio Account which I will deploy in coming Weeks most likely - although I am not rushing into it. Last Week I bought into Primary Health Properties PHP in my Income Portfolio (as always, see my ‘Trades’ page for full details) so my Cash has reduced from what it was and this is partly because PHP had dipped down a bit and it seemed a decent Entry Point but also because I realised that with £8000 just sat in Cash I was missing out on £400 over the Year when you take into account that the Blended Dividend Yield on my Income Portfolio is about 5% - so I was feeling a need to get the Money ‘working’ for me. To an extent it is about ‘Control what you can Control’ which means that many aspects of running a Portfolio are up in the air and left to the Gods but other aspects such as the Highly Likely Dividend Yield and of course the Dealing Fees are pretty much certain and will impact your Portfolio. So I wanted to take advantage of the Dividend Stream that the Cash can create for me going into the Future and it is worth bearing in mind that £400 in today’s terms is probably worth an enormous sum when compounded over many Years (the last blog I issued called ‘Free Money’ was very much about the importance of such Dividend Steams on our Portoflio Returns). Other than that I will be out enjoying the Sunshine and keeping on top of the Index Charts to see if I need to be Shorting any Indexes to ‘Hedge’ my Portfolio against Market Downside Risk - so I should have an enjoyable and lazy Summer !!! In tune with my recent Buy of PHP, there is much talk about the Government being on the verge of announcing a big boost to NHS Spending to the tune of 3% or 4% in Real Terms along with a 10 Year Settlement - this would obviously be good for PHP (and cause a problem for Corbyn as the Tories park their Tanks squarely on his well-manicured Allotment). June Market According to my 2016 copy of the UK Stockmarket Alamanac (slightly out of date but not enough to matter much), June tends to be a ropey Month and is the second worst with an Average Return of Minus 1.0% for the FTSE100. Bear in mind this is slightly out of date, but the chances of a Postive Return for June are just 38% which is pretty low. It gets worse - since 2000 the Average Return was Minus 2.0% - so it is not a pretty backdrop by any means and quite large falls are common in June. A typical June starts well for the first few Days but then falls away and just slides right through the Month. Gulp….. Despite this apparently Bearish backdrop I can’t help thinking that because we had such a difficult start to 2018 that perhaps we won’t be getting a big Drop over the Summer - there are probably a lot of People who got shaken out during the Sell-off early in 2018 and they might still be looking to Buy - especially if Rates get held down because Economic Growth is still weak and Inflation continues to be no big deal. We will look at the Charts in a bit. Blog Slate I have been working on a ‘Buy Rationale’ Blog for PHP and it is in reasonable shape for Part 1 but I have not done much on Part 2 yet (although that should be easier and faster to write). My intention is to get Part 1 out later this Week and hopefully that will be followed Next Week by Part 2. On top of that I have a few good Blog Drafts already written so I should be able to keep a flow going even if I am out enjoying myself a lot. I also have a long List of Blog Ideas to choose from for new subjects to get my teeth into. Nostalgia Time….. After writing about a typical June it really was a no-brainer that I should wheel out the classic ‘Bear Market’ WheelieBlog: http://wheeliedealer.weebly.com/blog/taming-the-bear-how-i-handle-nasty-markets Hopefully with all this talk of rough Markets and visits by Grizzlies I have totally overdone it and June will turn out to be a superbly positive month !!! Dow Jones Industrial Average DOW As always my Charts are simply ScreenGrabs from the superb ShareScope Software that I subscribe to and if you click on them they should get bigger in your Browser thing. On the DOW we had the Upside Breakout of the Triangle which is highlighted in my Yellow Circle and then we had a bit of a move up before getting into what looks like could be a Sideways Range between the Levels of 25086 at the Top and 24605 at the Bottom as marked on my Chart. This Range now gives us a good steer on what happens next - if the Price Breaks Higher above 25086 then expect more Gains and if it Breaks Down below 24605 then expect trouble. However, on the Downside, there could be good Support from the 50 Day Moving Average Line at about 24400 (marked by my Blue Arrow) and then from the 200 Day Moving Average at about 24000 which is pointed at with my Black Arrow. To the Upside, there is Resistance around 25400 and then 25800. 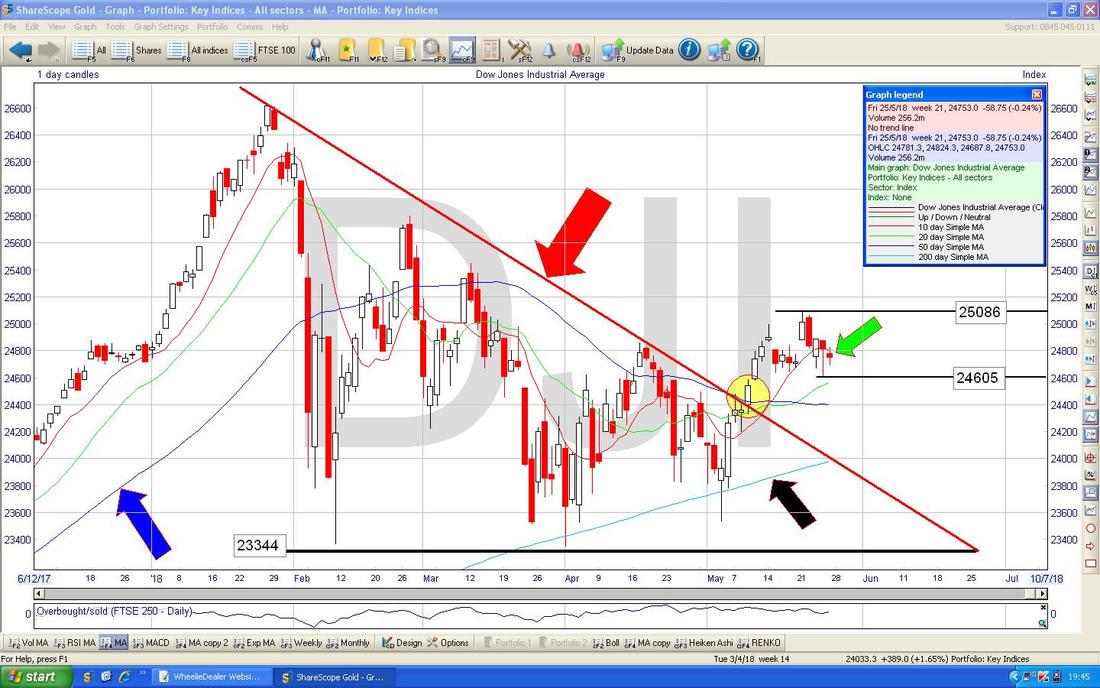
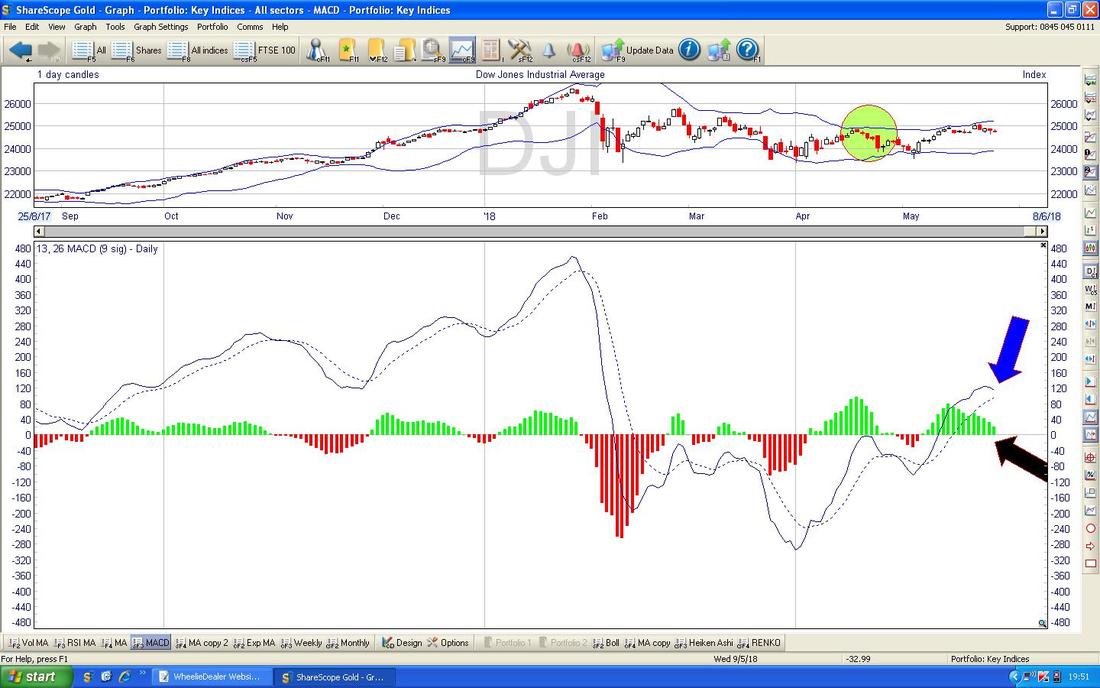
Really the Range that I have talked about is the key thing here but on my next Chart in the Bottom Window we have the MACD (Moving Average Convergence Divergence) and my Blue Arrow is pointing to how in the ‘Signal Lines’ format we are nearing a Bearish MACD Cross and the same thing is shown with my Black Arrow in the Histogram Bars format where the ‘Hump’ is moving towards Bearish. This is a very Short term Indicator though and simply a move to the bottom of the Range I talked about might be consistent with Triggering the Bearish MACD Cross before it then turns up in the Range again.
S&P500
I won’t dwell on this one because it is pretty much the same as the DOW but I will chuck in the EMA Chart because it is important (I could have shown it on the DOW but I decided to lob it in here - the DOW is similar). This is one of my Top Indicators and I am more and more basing my Trade Decisions regarding the Indexes upon this Cross. My Chart below has the Red Line 13 Day EMA (Exponential Moving Average) and the Green Line 21 Day EMA and where my Blue Arrow is we had a Bullish ‘Golden Cross’ where the 13 Day EMA crossed the 21 Day EMA from underneath and note we have not had the opposite Cross which is the Bearish ‘Death Cross’ and only once we have that will I get really worried and I might even Short the S&P500. The Nasdaq Composite is very much the same as well. 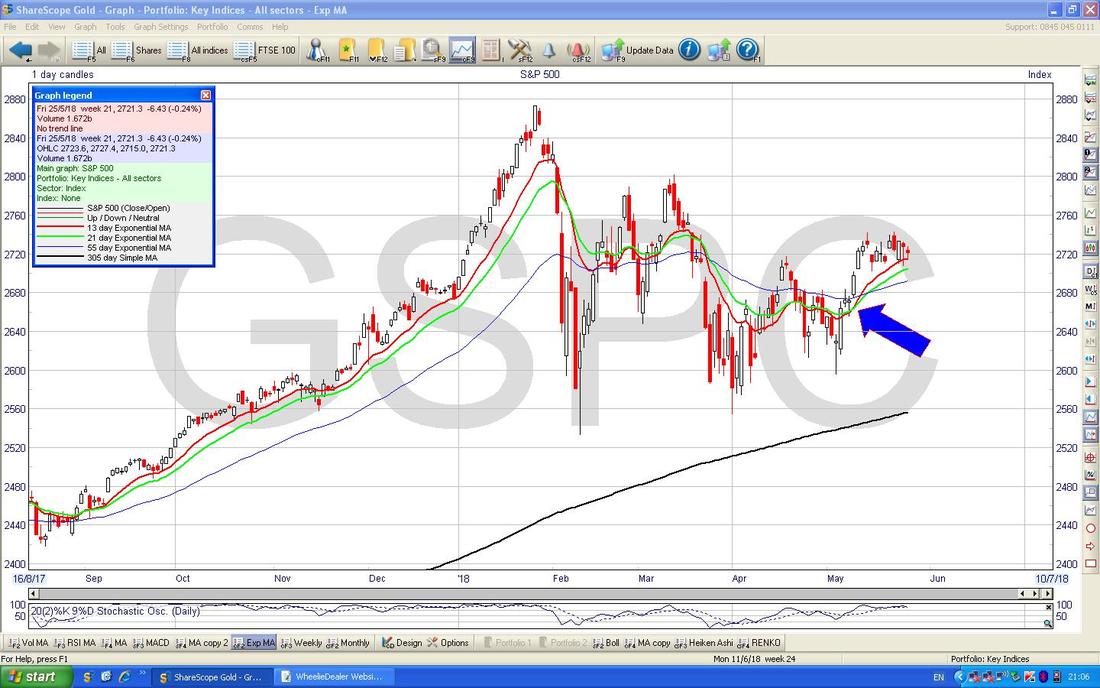
FTSE100
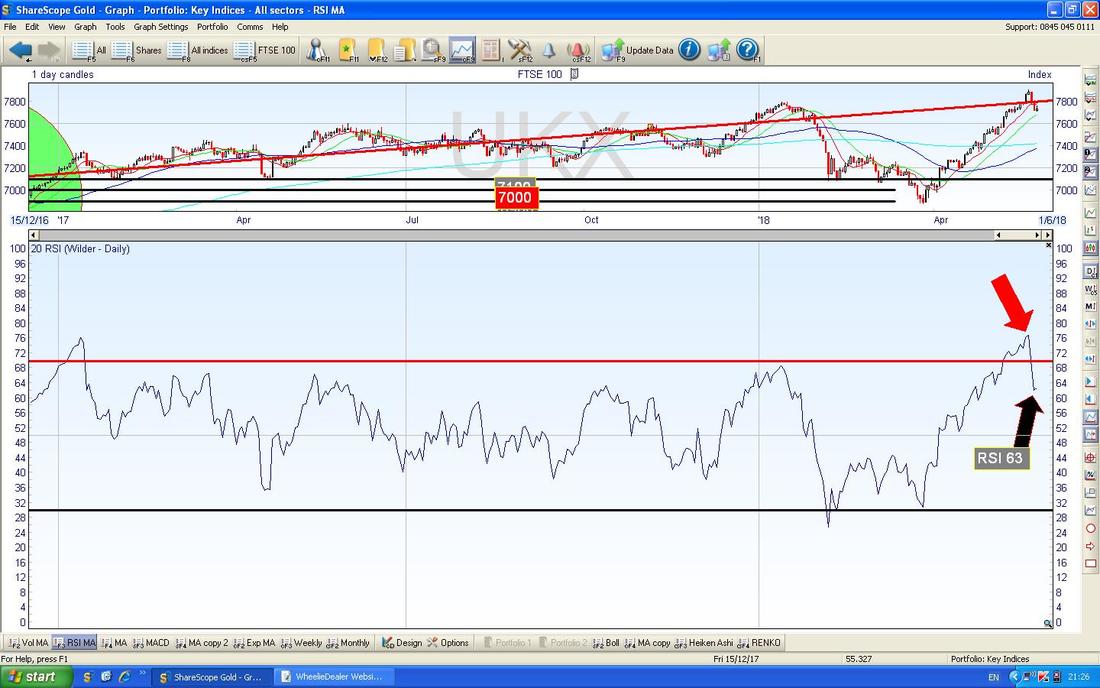
I must say the Charts we have had in recent Weeks have actually been quite interesting to me - there is a lot going on and some nice Signals that the Bull Market can keep running for a bit. Obviously with the FTSE100 hitting a New All Time High just above 7900 a mere 4 Days ago it is clear that the Bulls are very much in command and the move towards the end of Last Week looks like a healthy Pullback if anything and there is good Support just below at 7600 and 7500 especially. On my Chart you should be able to see the huge Yellow Narrow Box which marks the Uptrend which culminated in the New All Time High at 7903 then we have dropped for a few Days and my Green Arrow is pointing to a Small Doji Candle that we got on Friday which could easily turn out to be a Turning Point for the FTSE100 to turn up again. My Yellow Circle is highlighting how we are nearly at a 50/200 Day Moving Average Bullish ‘Golden Cross’ and if we get that it implies Weeks and Months of Upside to come - that would be most welcome !!! The 50 Day Moving Average is pointed at with my Blue Arrow and the 200 Day MA is pointed at with my Black Arrow and the 50 is about to Cross the 200 from Underneath which will give the ‘Golden Cross’. If the FTSE100 can turn up again soon and take out 7903 then that implies more gains and expect 8000 to tumble if that happens. 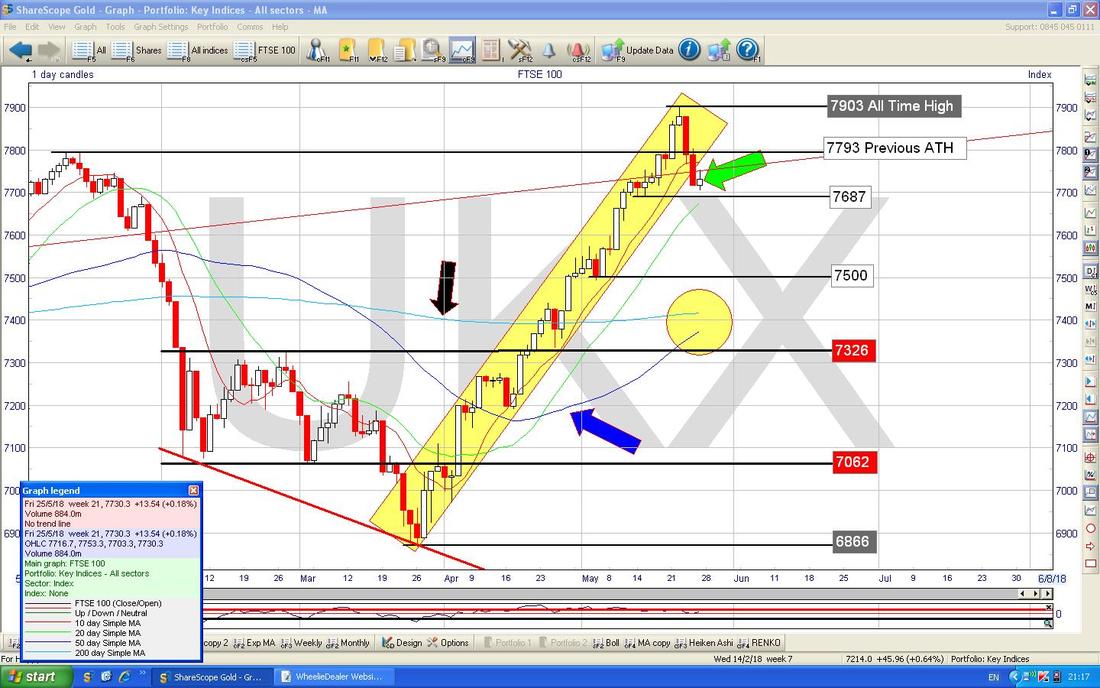
In the Bottom Window on the Chart below we have the RSI (Relative Strength Index) for the FTSE100 Daily and you should be able to see that it has dropped back from an Extremely Overbought Reading of RSI 77 or so where my Red Arrow is and now it is on a Reading of about RSI 63. That is still quite a high Reading and it might need to drop back a bit more but when an Index is really strongly Bullish as the FTSE100 seems to be at the moment, then it can move up again from what seem to be very High RSI Readings - if anything I would expect the FTSE100 to be moving up again soon. Of course is we get more Sterling Weakness as Markets fret about a General Election etc. then that could help the FTSE100 go up.
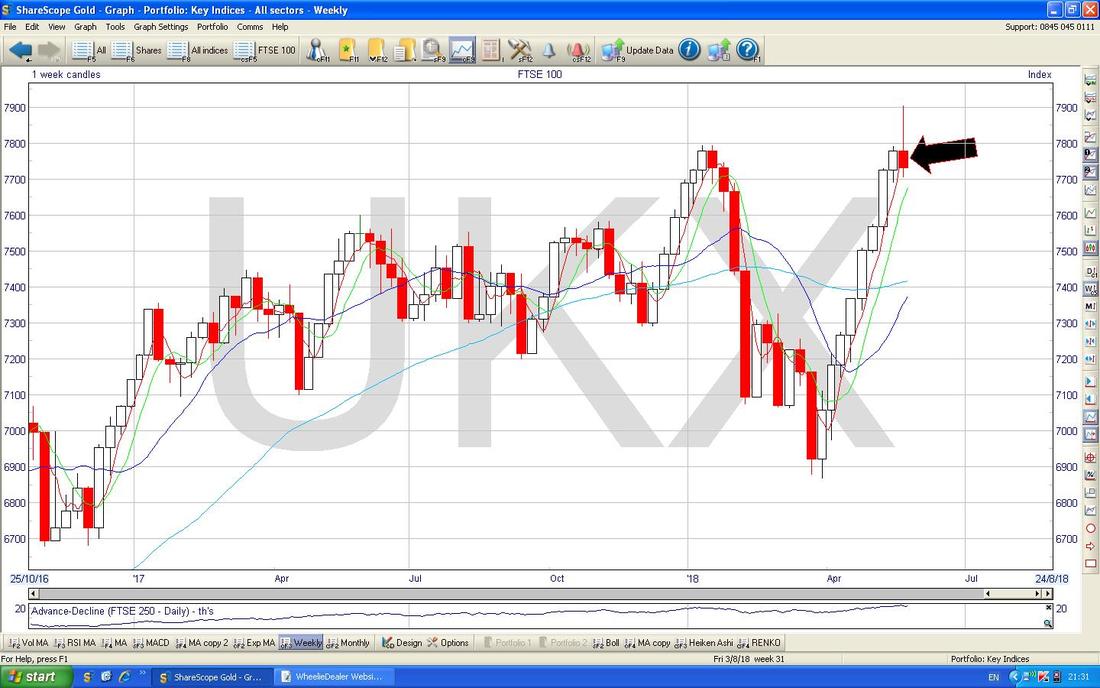
This is a bit more concerning. On the Chart below we have the Weekly Candles for the FTSE100 and my Black Arrow is pointing to a Bearish Looking ‘Inverted Hammer’ and after such a Signal I would expect a drop of some sort especially after such a Strong Move Up of White Up Candles in the Weeks before (that is what I mean by the ‘context‘ of a Candle).
On the Chart below we have the Daily Heiken Ashi Candlesticks and remember these are totally different to the usual Japanese Candlesticks. Where my Yellow Circle is we can see that the Candles have turned Big and Red and this suggests more Downside. However, they are a ‘slow’ Indicator and it is possible that the FTSE100 turns up and we don’t see this in the HA Candles until Tuesday at the Close (the HA Candles are a bit like a Normal Candle but they form over 2 Days rather than over 1).

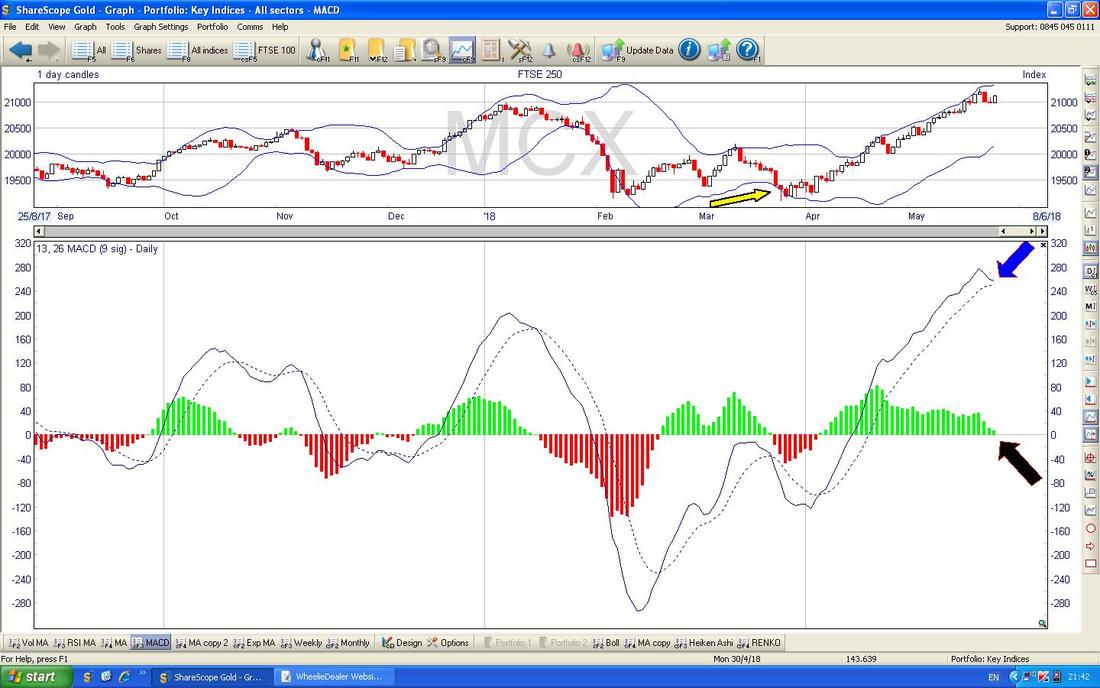
FTSE250
There are some interesting things going on here - my Chart below has the Daily Candles for the FTSE250 and largely it is similar to the FTSE100 but note where my Blue Arrow is that on Friday we got a Big White Up Candle which is very different to the little Doji on the FTSE100 and where my Yellow Circle is we have already had the 50/200 Day MA ‘Golden Cross’ which is bullish. 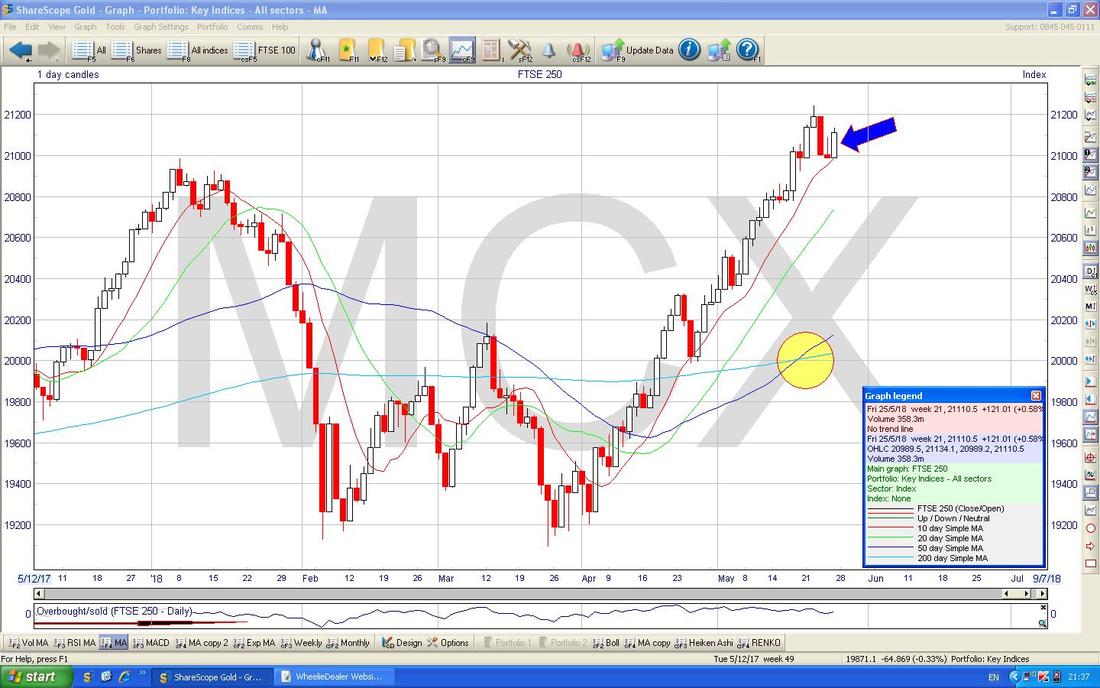
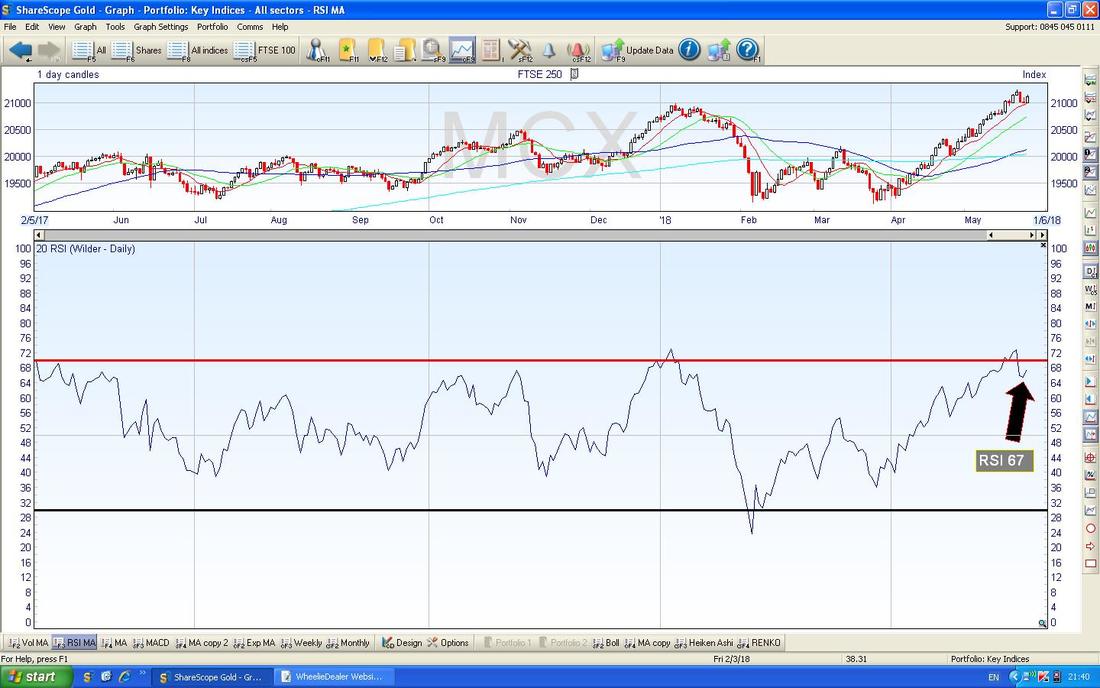
In the Bottom Window on the Screen below we have the RSI for the FTSE250 Daily - on a Reading of RSI 67 it is very high but as the FTSE250 is an Index of Smaller Stocks it can perhaps get away with a higher RSI Reading than the FTSE100 for short periods of time - it is very possible it can keep moving up from here.
In the Bottom Window on the Chart below we have the MACD for the FTSE250 Daily. My Blue Arrow is pointing to where we are very near a Bearish MACD Cross on the Signal Lines format and if you look closely you might see that it has flicked up and it might narrowly miss the Bearish Cross and ‘Glance off’ or ‘Skim off’ - if this happens it is extremely Bullish. My Black Arrow is pointing to this in the Histogram Bars format but the ‘flick’ is not so visible. This is something to look for on Tuesday Night after the Close.
Royal Dutch Shell RDSB
As I mentioned earlier I trimmed my Long Spreadbet Position on RDSB Last Week because I had a pretty chunky Position and it has been doing pretty well so I wanted to take advantage of the Move Up to trim my Stake a bit and lower my Risk/Exposure. I still hold loads of RDSB both as Shares and as Spreadbets and I have no intention of selling more yet. I just want to show the mechanism by which I timed my Sell and if you look at the Chart below you should see that RDSB had a superb run up of many Days and it clearly had got a bit toppy (this is apparent on the RSI Index as well) and I was tracking it up and waiting for a Candle Pattern to tell me that it was a good time to Sell. The First real Signal we got was where my Black Arrow is which was a Small Doji Candle which was ‘Inside’ the Big White Up Candle of the Day before. When we get such an ‘Inside Day’ we need another Candle to complete the 3-Day Pattern and so on the next Day we got a Big Down Red Candle (marked by my Blue Arrow) and this was the completed ‘Sell Signal’ so I then closed a third of my Spreadbet Position on the following morning. Note how I took my time and waited to be able to Sell my Position at a High rather than selling when the Price is low. 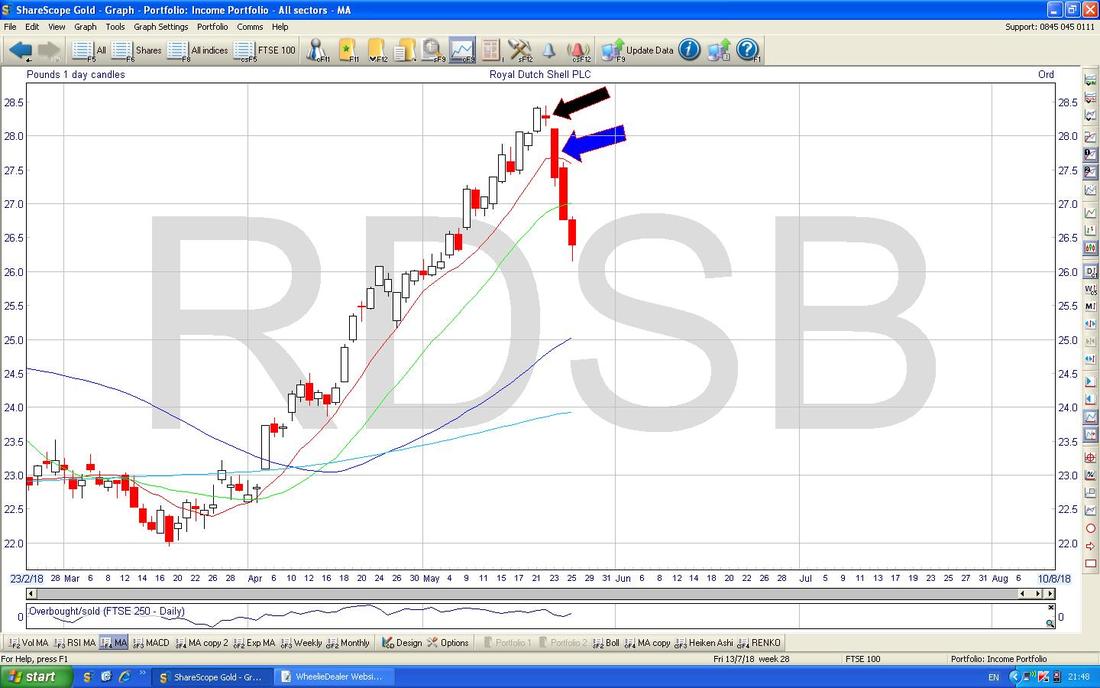
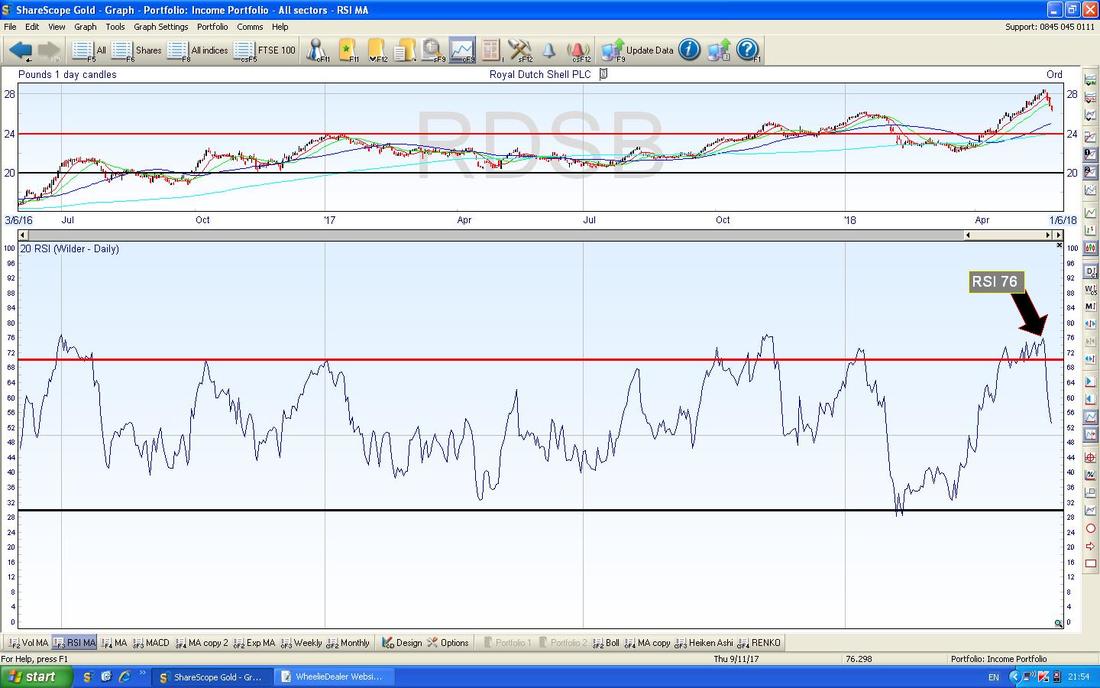
In the Bottom Window on the Screen below we have the RSI for RDSB Daily and on a Reading of RSI 76 where my Black Arrow is you can see that it was very ‘Overbought’ when I was stalking it with a view to Selling a bit of my Stake.
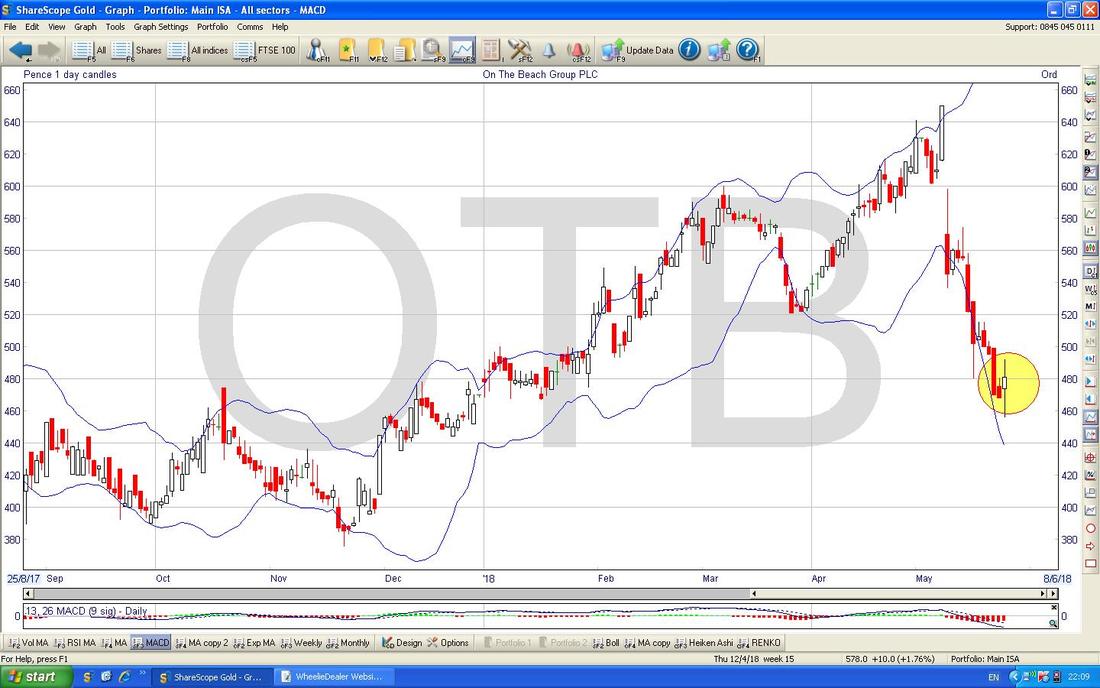
On the Beach OTB
This is another one I hold and it had done really well but in the last couple of Weeks it has totally fallen off a cliff but I reckon it could be rather over done now. On the Chart below we have the Daily Candles for OTB and you should be able to see the Big Move Down of recent Weeks and where my absurdly big Green Arrow is we got a bit of a Long Tails Doji (or ‘Spinning Top Doji’ in my language) which could mark a Turning Point from which to move up. Note also that the Price is now very near the 200 Day Moving Average Line which I have marked with my Black Arrow. OTB is now on a Forward P/E of 18.4 with a Forward Divvy expected of 0.9% - you wouldn’t call it hugely ‘Cheap’ but for an Internet Growth Play with expansion into the Scandinavian Countries in particular I am very happy to continue holding it (I have a feeling there is a ‘Buy Rationale’ blog I did about OTB somewhere). 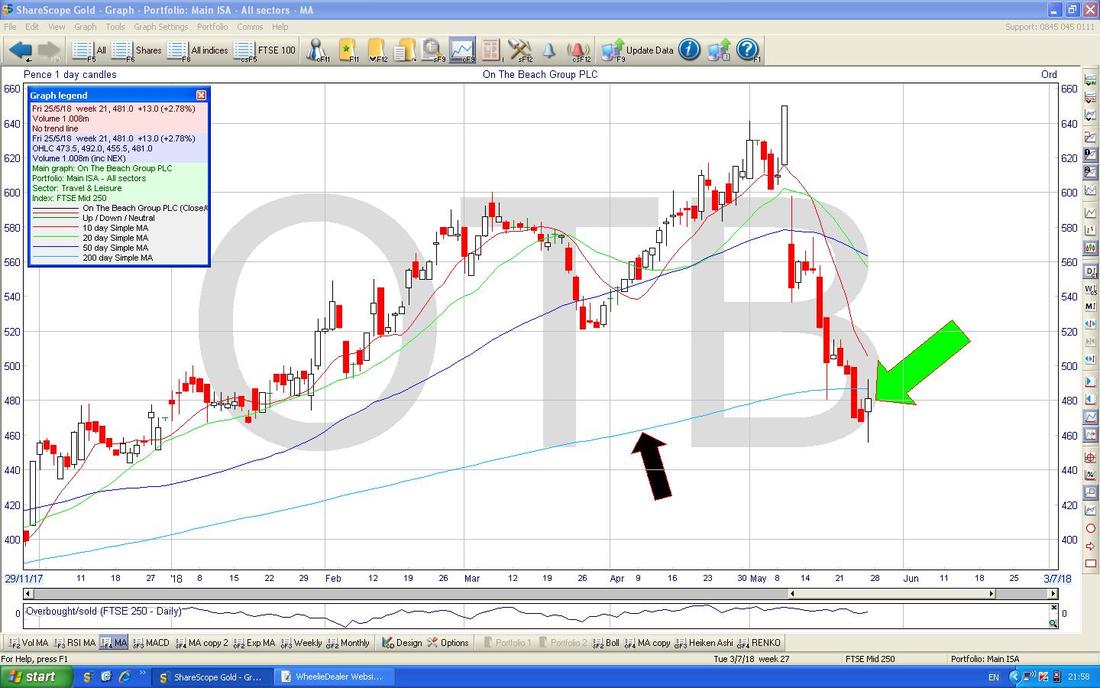
As you should be able to see in the Bottom Window on the next Screen - on a Reading of RSI 36 OTB is pretty low and ‘Oversold’.

On the Screen below we have the Daily Candles for OTB with the Blue Wiggly Bollinger Bands above and below. Where my Yellow Circle is note how the Candles (and the Price) have moved away from the Bottom Bollinger Band - this implies either going Sideways now or moving up.
And finally we have the Heiken Ashi Candles for OTB. Where my Black Arrow is look how the Candle is still Red but it has ‘Narrowed’ - this could be marking a Turn and we ideally need another Candle which we will get on Tuesday after the Close to tell us if it is now going to turn White and help confirm a move Up.
Right, I will leave it here - Good Luck for the coming Week, Cheers, WD. 
0 Comments
Leave a Reply. |
'Educational' WheelieBlogsWelcome to my Educational Blog Page - I have another 'Stocks & Markets' Blog Page which you can access via a Button on the top of the Homepage. Archives
January 2021
Categories
All
Please see the Full Range of Book Ideas in Wheelie's Bookshop.
|
