

|
educational blogs |
|
I don’t know how long this Blog will be because I spent all of Saturday at the Master Investor show and today we had the start of the 2018 MotoGP Season with the races from Qatar so I am feeling quite worn out and have square eyes from looking at screens !!
There are a few things I want to cover before looking at some Index Charts and the main thing being the upshots of a long chat I had with Richard Wolanski, the CFO of Avation AVAP, at the Show (I hold Shares in AVAP).
I really enjoyed my visit to Islington and am very pleased I took on the terrible weather (will this Winter ever end ?!!!) and am thanking my lucky stars that I left the Pizza Place next door just in the nick of time because once I got back to Windsor the side roads were getting quite white and if I had left it much longer it might have not really been all that ‘fun’. Snow is difficult enough for any driver with a Front Wheel Drive Motor but throw in Hand Controls and it does get a bit exciting sometimes - normally I avoid Snow like the plague but I am so fed up with cow-towing do this relentless Winter and this time I stood up to the swine.
It was great to meet up with loads of old mates and lots of new people and many who I have spoken with on Twitter for years but never actually met in ‘The Real World’ - that was really fun and an enjoyable way to mix Investing/Trading with pleasure. It was particularly nice to meet several people who have read my Website blurb and Tweets for a long time but I have never spoken to them - it’s very inspiring to hear that they find what I write interesting and helpful and that is the whole point of my scribbles. A big thanks to Dee (@OhriDee on the Tweets) who after having an interesting chat with me in the Restaurant area bumped into a couple of fairly new Investors/Traders down on the Exhibition Stand part and recommended that they look at my Website etc. and he also suggested that they come and find me in the Restaurant (I use the term loosely, the food there gets more dodgy every year !!). Anyway, they came up and found me and I enjoyed being able to give them a few steers on the best ways to go about getting properly started and to answer many questions they had that are pretty usual for anyone who is starting to get serious about their Stocks. I could see a glint in their eyes and I expect they will go on to become very good Investors if they keep away from all the WheelieBin AIM rubbish and stick to quality Companies and realistic expectations etc. It’s funny because I find that every person I speak to at such Shows has different expectations of the event and they attend for many different reasons but the common factor is that everyone seems to enjoy them - if you have never attended such a thing I suggest that you make the effort because it is definitely worthwhile. Having said that, for myself, I tend to find the ability to interact with some excellent Traders/Investors is what is really helpful and I would suggest that even if you just go for the Speeches and stuff it is worth striking up conversations with other people who are Private Investors because it can be immensely useful both to get Ideas for Stocks to Buy etc. but also for their thoughts on how best to run a Portfolio and do your Trades etc. Anyway, the next one around London is the UK Investor Show down near the Houses of Parliament and that one is on Saturday 21st April. I intend to be there and I am keeping my fingers crossed that we won’t have any snow at that point !!! Last Week Markets have felt really soggy recently and it has not been easy. This was borne out by my discussions with other people at Master Investor and it was clear that many people are down on 2018 at the moment although not by much. Last Week I managed a Gain of 0.4% which isn’t much but I guess in the context of such draining Markets it’s not all that bad. Having said that, I got the sense that most of it came from just a couple of Stocks like MPAC and FEVR which did well and a lot of stuff just did nothing much. I would love to boost my Returns by using the odd Index Bet here and there but with the Markets so flat and directionless, I am just not seeing any decent opportunities to go Long or Short (I can‘t be doing with Day Trades). I will look at the Major Indexes later on in this Blog and I am sure the reasons for my reluctance to place any Trades will become clear. In terms of Strategy nothing has changed. I am happy with the Stocks I hold (with a couple of exceptions and even that horrific FCCN has perked up !!) and not in a position to buy more or add to my Holdings in the main - so I am pretty much just biding my time and looking for the odd Index Trade if a really good Buy Signal or Sell Signal is thrown up. Still I hear talk of imminent disaster and Market Meltdowns but frankly I see no actual evidence of it and I am staying hugely Long on Stocks until something dramatic happens. With the World seemingly undergoing a synchronised period of GDP Growth I see no reason to expect a big Drop - but of course anything can happen. However, rather than worrying about what might, or might not, happen, I am just scanning those Charts for actual clear Signals that something is going on - if there is a Meltdown, the Charts will confirm/predict it. As I will show later, we have Triangles on the US Indexes which will give us a direction and the UK is in a Sideways Range which will help us determine where the Indexes are likely to go. Blog Slate The First Part of the Buy Rationale on EU Supply EUSP went out last week (you should be able to find it just below this Blog on the Blog Page) and my intention is to put out the Second and final Part this Week - although I am pretty busy with stuff so it might not appear until very late in the Week (or even next week !!). As usual I have thought up many more ideas for Blogs to write than actually getting on with writing the damned things - but the upside of this is that I am unlikely to be sat twiddling my thumbs and staring into space thinking “well what the hell am I going to write about this week?” Avation AVAP I have been invested in AVAP for at least 3 years I think and am very happy with how things have played out. It is a Singapore Headquartered Aircraft Leasing Business run by the CEO Jeff Chatfield who used to be the boss of Skywest SKYW which was taken over by Virgin Australia (I was invested in that also and knew the business pretty well and I certainly think Jeff is very on the ball). You can read a Blog I wrote about AVAP years ago here and this outlines the details of the Business Model - most people simply do not understand the Business (or take time and effort to do so !!): http://wheeliedealer.weebly.com/blog/avation-avap-buy-rationale Obviously this Blog is from a while ago so the numbers in it with regards to Planes and Financials will all have changed but much of what I have written will still be valid. Anyway, in a bit I will talk about numbers. I made a special effort to hunt out Richard Wolanski (AVAP CFO) at the Show because I had a few questions and because I have always got on very well with him and I find him a fun chap to have a gas with. I tend to be extremely selective with which Directors and Stands I talk to and I always ‘plan’ before the Show who I want to talk to - I just don’t see much point in traipsing round every Stand at the Show and talking to everyone because you just end up with a big mass of ‘Noise’ - I find it far more useful to know the Companies beforehand and to have a specific ‘List’ of Questions that you want to know the answers to and I also think it is worth putting yourself in the position of the poor people having to ‘Man the Stands’ (or ‘Woman the Stands’ if that is a phrase in these PC days !!). In my dim and distant past I have often had to appear on an Exhibition Stand and believe me it is soul destroying and I think the People on the Stands really appreciate it when they talk to someone who actually knows a fair bit about the Business already and therefore asks sensible and more stretching questions and also understands the answers. If you are on a Stand, there is nothing worse than being confronted with your 76th Person of the Day who wants to know the basics of the Company from scratch and you have to trot out parrot fashion the same old robotic lines which are boring you senseless. So next time you talk with People on a Stand, put yourself in their shoes and treat them like proper Human Beings and you will get so much more out of the discussions. Anyway, I got sidetracked there, the point is that I had a very good chat with Richard and found out a lot of useful stuff as follows:

After so much on AVAP, I might as well chuck some Charts in - first off we have a Long Term Chart and I have used the ShareScope ‘Toggle the Trendlines’ Button to show the Uptrend Channel with the Blue Lines (although obviously the Trend has been up on this Stock and you shouldn‘t really need the Lines to see this !!). 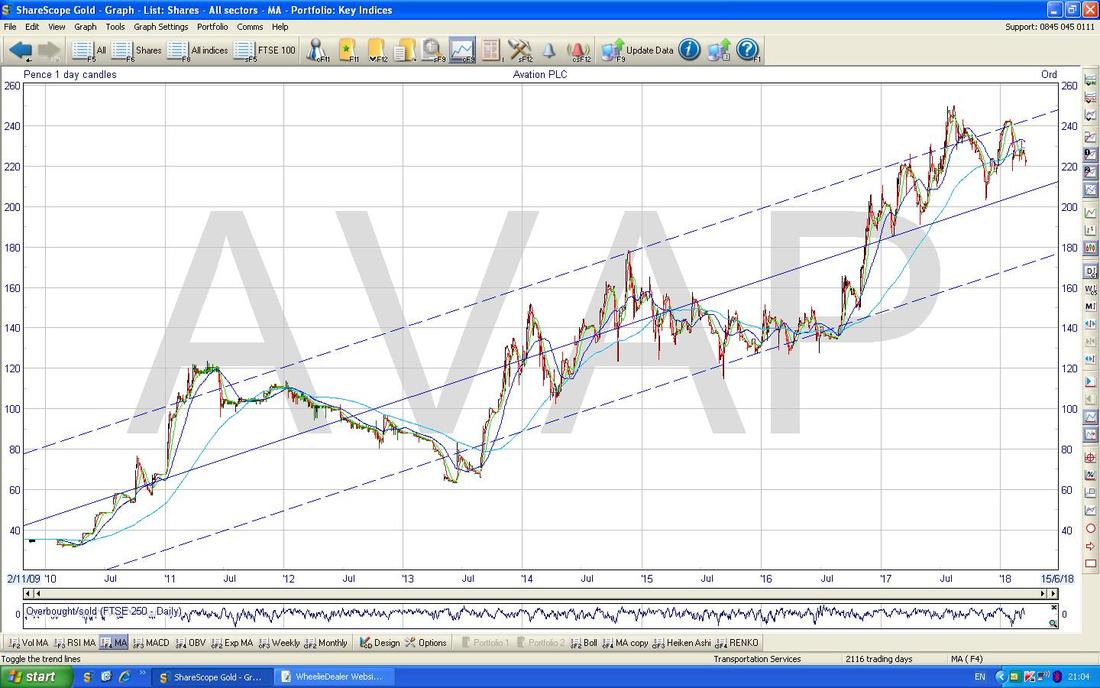
On the Chart below I have zoomed in to the last year and a half or so. First off please look at the Black Line which I have marked with ONE Black Arrow - this one is quite a valid Support Line I would say because there are several ‘Touch Points’ and then note my Upper Black Line (marked by the TWO Black Arrows) and this is really a Parallel Line and I have gone for the ‘Best Fit’ here. Anyway, these Lines suggest that there is good Support at down to about 210p and to the Upside it could be hard to get through the 250p Level (note there is Horizontal Resistance here as well coming from the Green Box I have drawn in).
As always you can click on the Picture and it should grow bigger so you can see it better. My Yellow Circle is trying to highlight where the Darker Blue 50 Day Moving Average Line is moving down towards the 200 Day Moving Average Line which is the Lighter Blue Wavy Line - if you look at the ‘Graph Legend’ Box in the bottom Right Hand Corner this might make more sense. Anyway, if the 50 Day MA Crosses the 200 Day MA we would get a ‘Death Cross’ and this could be bad. Looking at this Chart I would say a Buy on AVAP would make sense down around the 210p level for ‘Bottom Fishers’ or above 250p on a Bullish All Time High (ATH) Breakout - but in terms of the Fundamentals it does look cheap. Perhaps a good way to Buy would be to let it fall down to the lower Black Line (one Black Arrow) and Buy it if it rises up off this and gives appropriate Candlestick Signals (e.g. A Hammer or Harami or something). It is clearly quite a choppy Stock which is normal if something is smallish and has low liquidity. The Risks highlighted in my previous Blog still apply in parts but the biggest Risk AVAP faces is probably around the Cyclical nature of the Airline Industry - however, as things stand, Global Growth seems to be improving, not going into Recession. 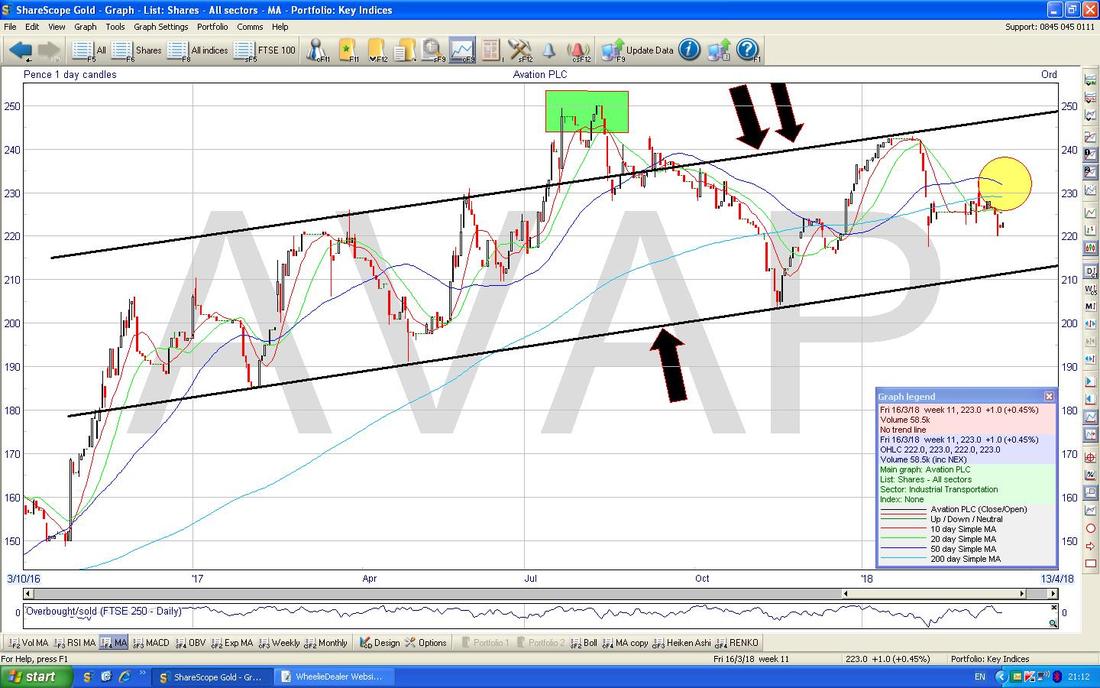
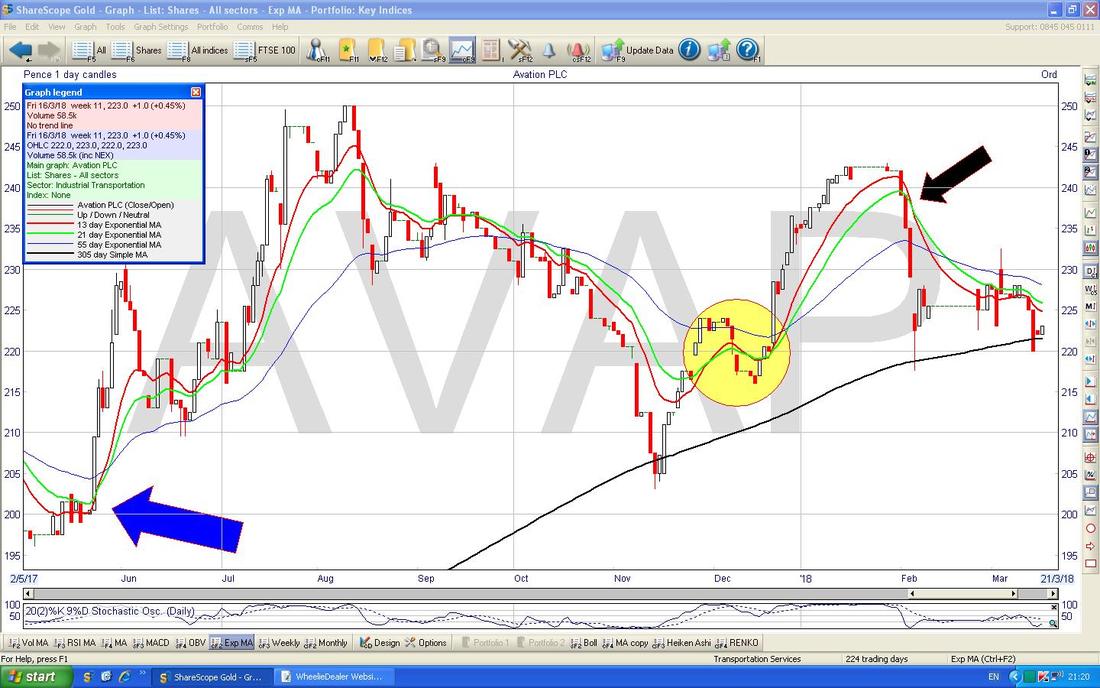
The Chart below shows my adored 13/21 Day Exponential Moving Average (EMA) Lines as the Red and Green Lines. My Black Arrow is pointing to where there was a 13/21 Day EMA ‘Death Cross’ and this is still ‘in force’ until we get a Bullish 13/21 Day EMA ‘Golden Cross’ like we did where my Yellow Circle is or where my Blue Arrow is - it could be a good idea to wait to Buy until we get that Golden Cross again as it often means a few Weeks of gains to come.
Right, the Clock is ticking so we better look at those Indexes - I need to Proof Read and upload this effort to the Website before I fall asleep !!
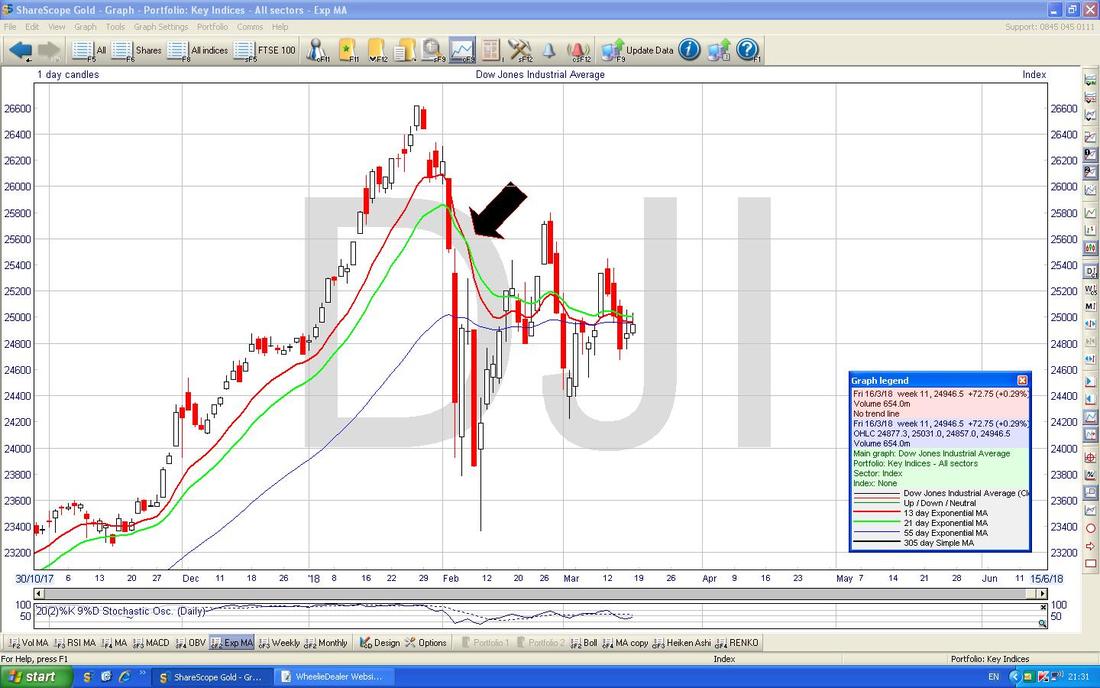
The Dow Jones Industrials Index (The DOW) First off this is pretty much a Chart which I took a picture of using my Fone and whizzed out on Twitter probably on Thursday Night last week. It should be self-explanatory but the obvious point (no Pun intended !!) is that there is a beautiful example of a Triangle here and depending on how the Price breaks-out of the Triangle, that will determine the likely next direction for the DOW to move. Note that on Friday we got a tiny little Candlestick for the Day and it is still well within the Triangle and seems to want to go right to the Point !! We really are getting to the crunch here and I guess in the coming Week we will get the Breakout and Bulls will want it to Break upwards. It’s gonna be interesting - if we get some force behind any Breakout then that might be important - for instance, if it Breaks Down but with a Big Down Candle and a lot of Volume, then that might mean a lot of trouble ahead………(could be a time to Short). 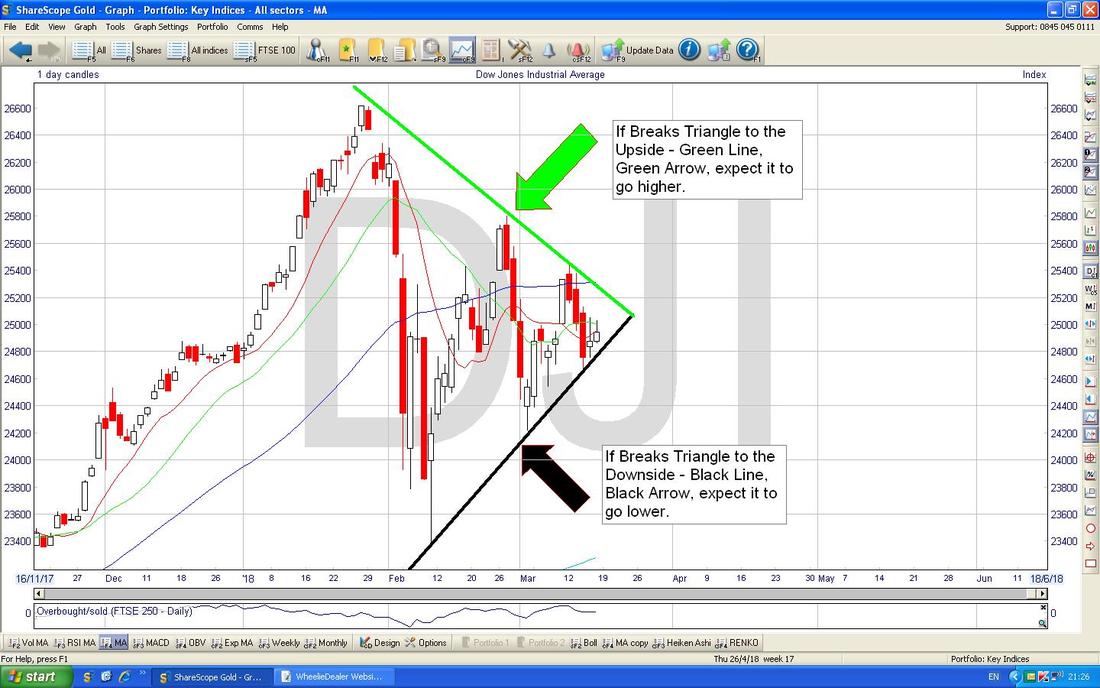
As I mentioned on the AVAP Chart above, the Chart below shows the 13/21 Day EMAs for the DOW - where my Black Arrow is please note that there was a Bearish ‘Death Cross’ and that this is still ‘in force’ because we have not had a ‘Golden Cross’ yet - perhaps this is hinting that the Triangle will break downwards but there is no point guessing at this stage - let the Triangle tell us what is going to happen.
S&P500
The DOW obviously is a bit of a ‘flawed’ Index because it is only 30 Mega Cap Stocks and the S&P500 is a much broader US Index. However, despite not being as ‘clean’ and precise as the Triangle on the DOW, there is really a Triangle on the S&P500 in a similar way, as per my Blue Line and Black Line. As before, if the Price Breaks upwards and takes out the Blue Line (Blue Arrow) then it is probably good news for Bulls and if the Price breaks downwards and through the Black Line (Black Arrow) then it is Bad News. 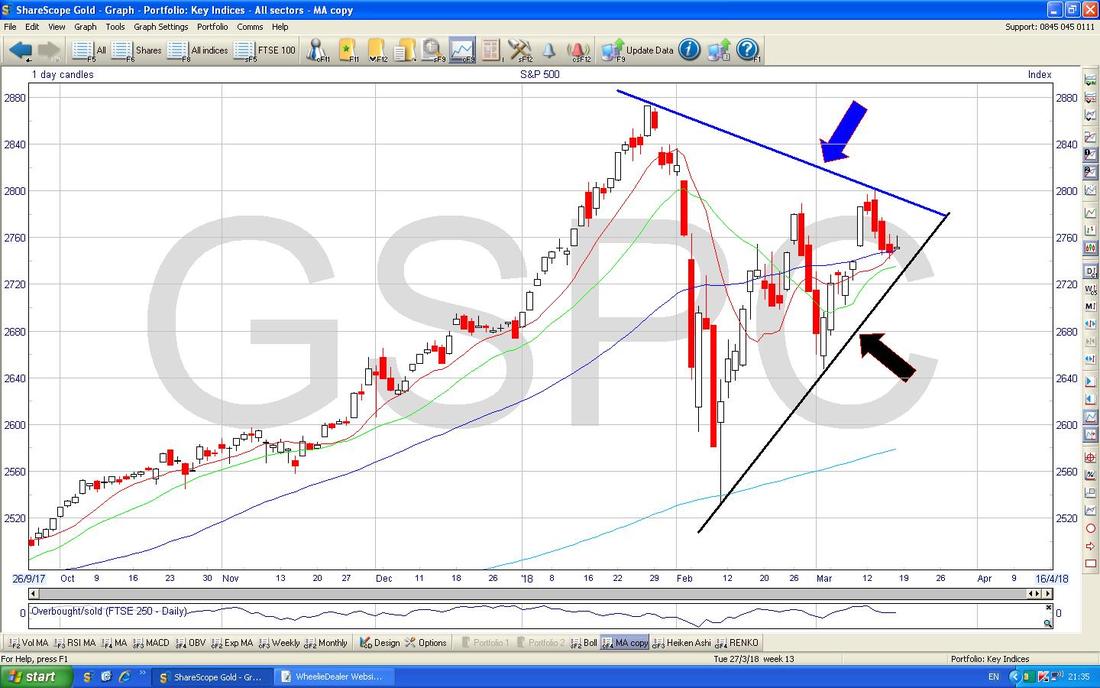
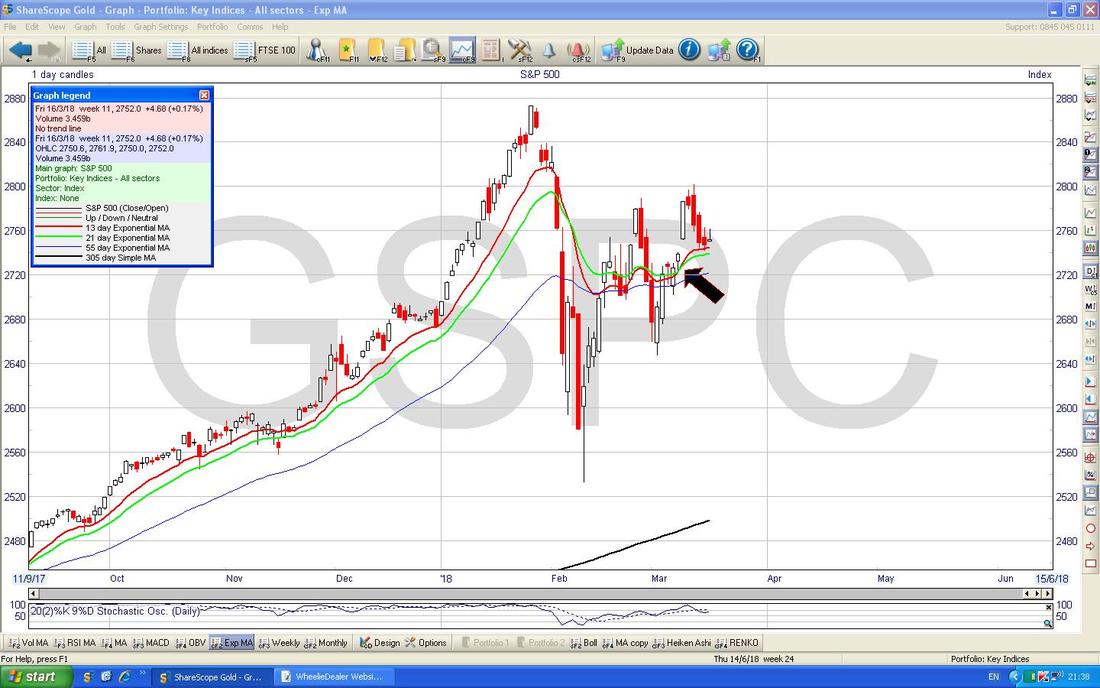
This is slightly more promising than the DOW - below we have the 13/21 Day EMA Lines for the S&P500 Daily and where my Black Arrow is we have a Bullish ‘Golden Cross’ which is still ‘in force’.
Nasdaq Composite (US Tech)
This Index has been immensely Bullish for ages and with the situation how things are now, it is still pretty much in that vein. My Black Arrow is pointing to a Big Red Down Candle from Tuesday 13th March (unlucky !!) and the Price has been dropping a tiny bit since that. Note where my Green Circle is around the 7500 Level that we have a lot of Support as that was the very recent Previous All Time High (remember, ‘former Resistance becomes Support‘). It is an interesting situation because although this Index seems very expensive, the fact is that many People have been ‘trained’ to ‘Buy the Dip’ and that could well happen here. It does strike me that there has been a bit of a tussle here between the exciting new Tech Stocks and the old fashioned boring stuff in the DOW - the S&P500 seems to be a mix of both. 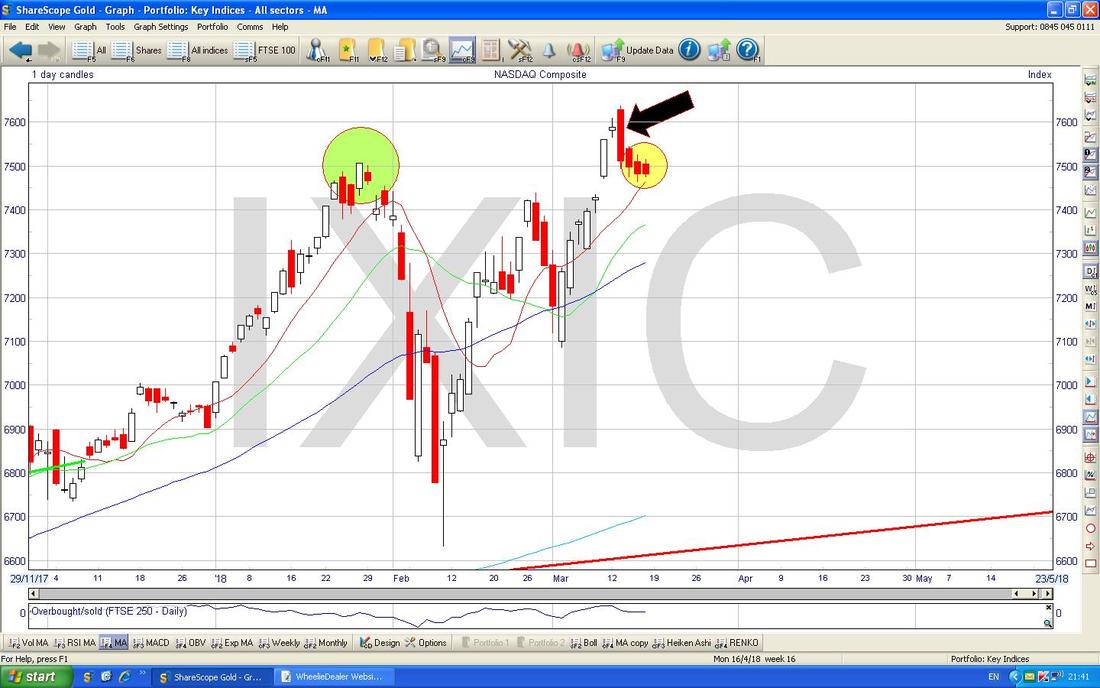
FTSE100
In a rather similar way to the DOW and S&P500, the picture here is quite clear - in this case rather than a Triangle where we are waiting for a Breakout, we have a Sideways Range between 7062 at the Bottom and 7326 at the Top - depending on how it ‘Breaks’ that will give us the most likely future direction. Until it Breaks I can’t see a lot of point in doing anything - Bulls want the Price to Break-out over 7326 and I would suggest it is best to wait for a nice End of Day (EOD) Close up above this before going Long and Bears want a Break down below 7062 in a similar way but again I would wait for an EOD Candle (if you Buy or Sell it intraday you might get a ‘False’ Breakout that reverses on you.) My Yellow Circle is to show a Bearish ‘Death Cross’ between the 50 and 200 Day Moving Averages (the 50 is marked by the Black Arrow, and the 200 by the Blue Arrow) - such a Cross implies trouble ahead UNLESS we get a move up very soon in which case we might be able to save the situation. My assumption is that the FTSE100 will follow the US Markets and whichever way those Triangles breakout will determine where the FTSE100 goes next. That’s it this Week - I hope everyone keeps their wits about them and stays calm and remember if things get scary and your emotions go through the roof, just remove your physical presence from looking at a Computer or Fone Screen etc. and go and do something completely different and more enjoyable like cleaning out a Sewer. Cheers, WD. 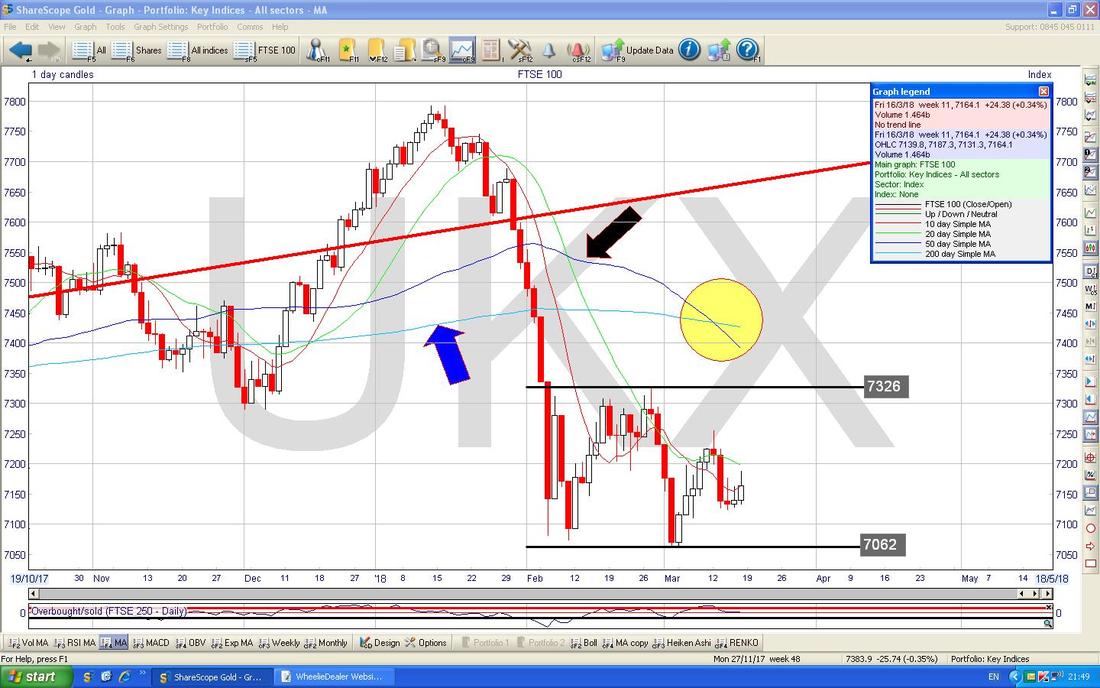
4 Comments
Paul Hunt
19/3/2018 09:11:36 am
Great article on AVAP which has prompted me to take a closer look. I will see you on the 21st. My son is coming as well so he must be taking this investing stuff seriously to give up a Saturday!!
WheelieDealer
20/3/2018 12:15:22 am
Hi Paul, thanks for those words - glad you found the stuff useful. That is brill that you will attend the UK Investor Show with your Nipper - after the good trip I had to Master Investor over the weekend I am looking forward to that one !! (and there might even be some decent weather by then !!)
Geoffers45
19/3/2018 10:34:30 am
Very informative as usual. Thanks for sharing.
WheelieDealer
20/3/2018 12:16:58 am
Hi Geoffers45, thanks for the Comments - great you liked the Blog and I hope it helps you think about AVAP and what is going on with this very soggy set of Markets !! Leave a Reply. |
'Educational' WheelieBlogsWelcome to my Educational Blog Page - I have another 'Stocks & Markets' Blog Page which you can access via a Button on the top of the Homepage. Archives
January 2021
Categories
All
Please see the Full Range of Book Ideas in Wheelie's Bookshop.
|
