

|
educational blogs |
|
With the Brexit Vote now under 2 weeks away and the Markets taking a turn downwards at the end of last week, it seems very likely that the ‘Buyers Strike’ I have talked about for many months is finally upon us. It certainly seems like the tone has gone decidedly negative as the Polls have narrowed and the likelihood of the ‘Leave’ Campaign winning has increased - the momentum is clearly with the gallant & sexy Brexiteers.
However, this might be how things ‘feel’, but what are the Charts actually telling us? Remember, a big part of this game is to “Trade what you see, not what you feel” and the Charts are how we can identify if the Markets are actually behaving in the way we might think they are.
Historically, according to the UK Stockmarket Almanac 2016, the coming Week (w/c 13th June 2016) is Up for 47% of Years and the Average Return has been MINUS 0.5% - so it is a very negative backdrop and remember that June is historically the 2nd Worst Month of the Year (only September beats it for ‘Worstness’).
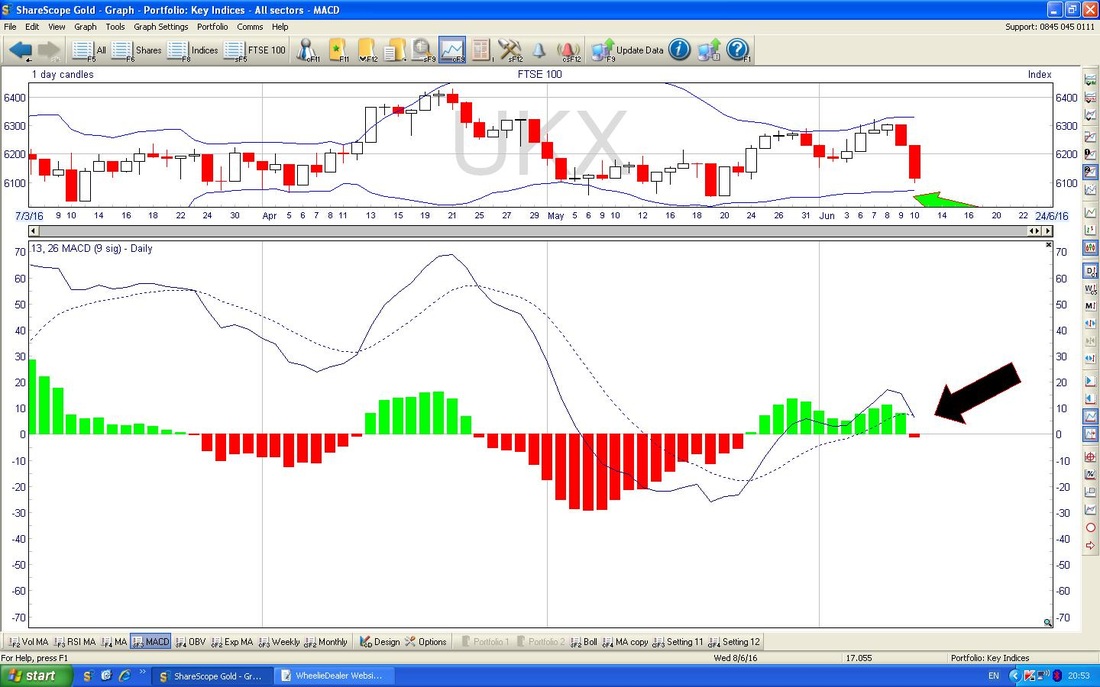
Right, let’s get on with these Charts because they are probably very interesting - the bit that I will pay particular focus on is the likely Support Levels to help plan how to Trade in the coming days. My main focus is to get my Short FTSE100 Positions Closed and to then start with some Top-up Buys of Stocks I already hold - I won’t go crazy, but I want to get perhaps another 8% or so of my Total Portfolio Value back into the Markets - probably half of this with Cash that sits in my ISA (after closing the XUKS hedge if all goes to plan) and the other half via Long Spreadbets (so this would be about 4% of extra Exposure via Spreadbets). To this end I will be looking at where the Support Levels are and trying to get a feel of how low we are likely to drop - I will then be trying to gauge sentiment and use the Candlesticks to tell me when we are near the Bottom. I will most likely try to close my FTSE100 Shorts in stages and gradually reduce my Short exposure. As I mentioned in my recent Blog about ‘Scenario Planning’, I expect Markets to be weak running up to the Brexit Vote and then to see a Rally whatever the Result is as the Market has a Major Uncertainty removed (ok, the Rally after ‘Remain’ may be stronger than any Rally after ‘Freedom’). FTSE100 As ever, I have done some ScreenShots from the ‘WheelieWorkbench’ which is the sublime ShareScope Software. The Chart below shows the Daily Candles going back around 8 months for the FTSE100. First off my Blue Arrow points to a Big Red Down Candle from Friday 10th June 2016 - this is obviously a Bearish looking Candle and note it closed very near the Lows of the Day, so not much Buying Pressure. Note also how Friday’s Candle has dropped down through the 200 Day Moving Average which is the Light Blue slightly wavy Line. As I mentioned in the introductory text, I am really focused on the Support Levels. As you should be able to see, on Friday it found Support at 6100 and if this fails then it is likely that it drops down to the next Support Level at 6036 or just above - I have highlighted this with the Red Box behind the number. If 6036 fails then 6000 is next up and so on. If you look right down at the bottom of my Support Levels ‘Tree’, then you should see the Blue Box with 5500 in it. This is the Support Level that held back in February 2016 when we had that nasty surprise Sell-off and I think the worst case we will see in coming Days is a revisit of 5500 - it might not even go this low as there is a lot of Support higher up. However, once Markets get in a Fearful mood and panic sets in (I think it might) then we could easily see the FTSE100 fall very quickly and take out many of these levels. If 5500 fails, then I will no doubt update my thoughts via Tweets and/or on the Website. 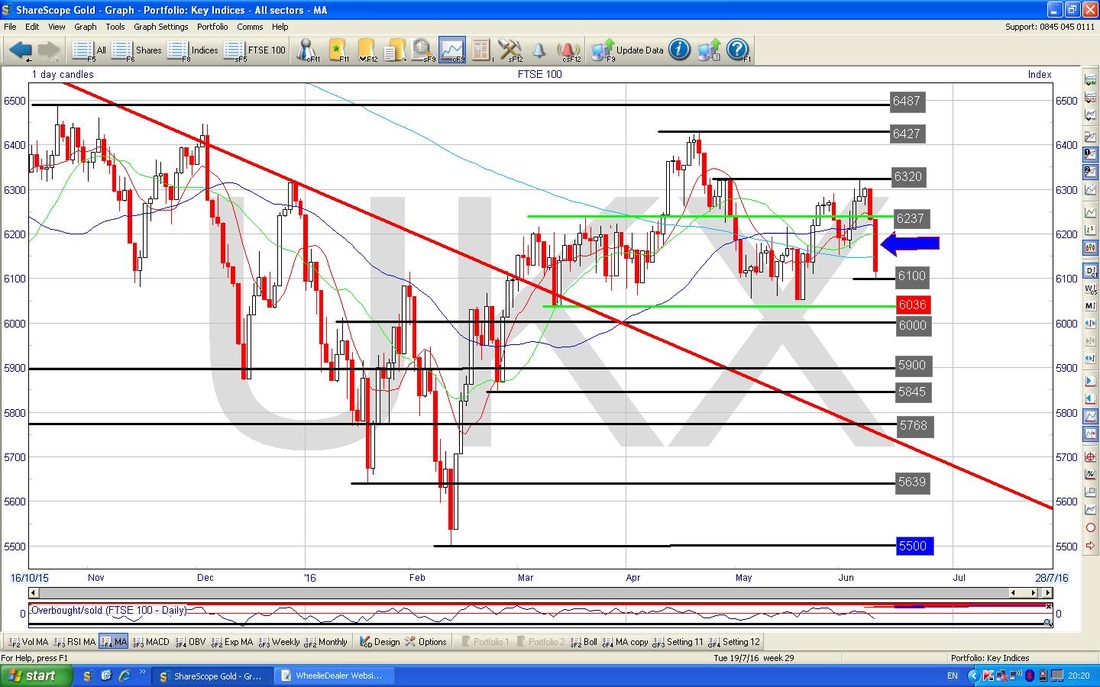
The Screen below in the Bottom Window has the RSI (Relative Strength Index) for the FTSE100 Daily. The current reading is about RSI 45 (marked with the small Black Arrow) and this can obviously fall quite a bit more before getting ‘Oversold’. The usual definition of ‘Oversold’ is RSI 30 which is the Black Horizontal Line - but if you look to the left, I have put lots of coloured Arrows in to show Low Points in previous Sell-offs.
Note back in February the RSI dropped to only RSI 36 - this really surprised me because normally when things are really damn scary, the RSI gets extremely low. However, if you look back to my Green Arrow to the August Sell-off in 2015, it dropped as low as RSI 20 - that is really low. 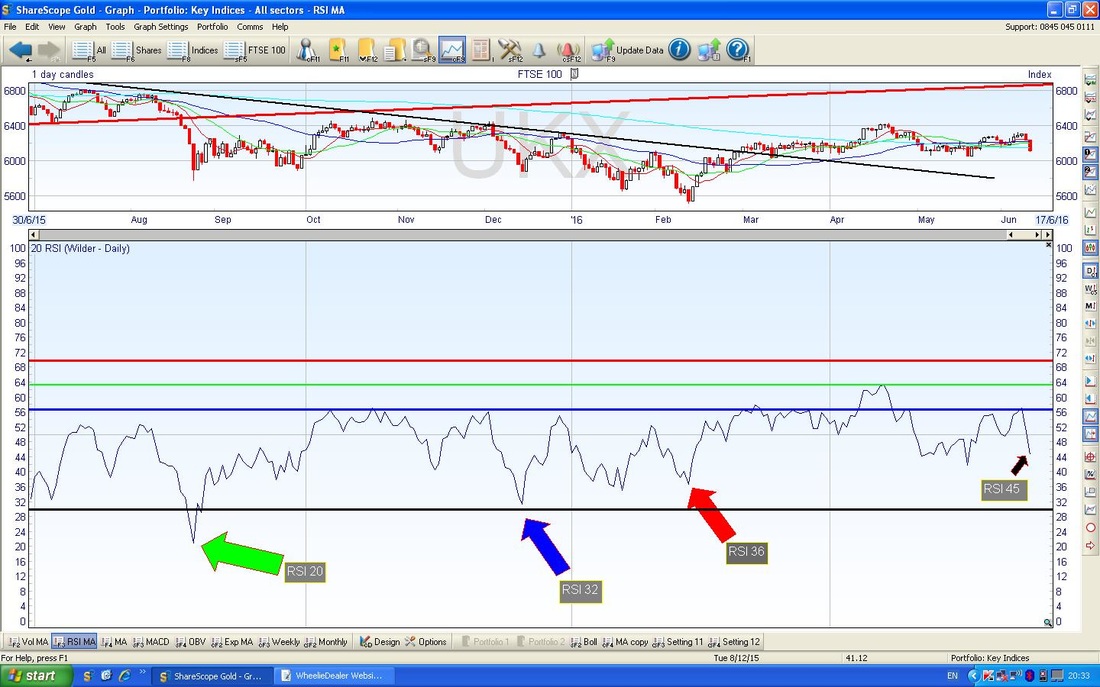
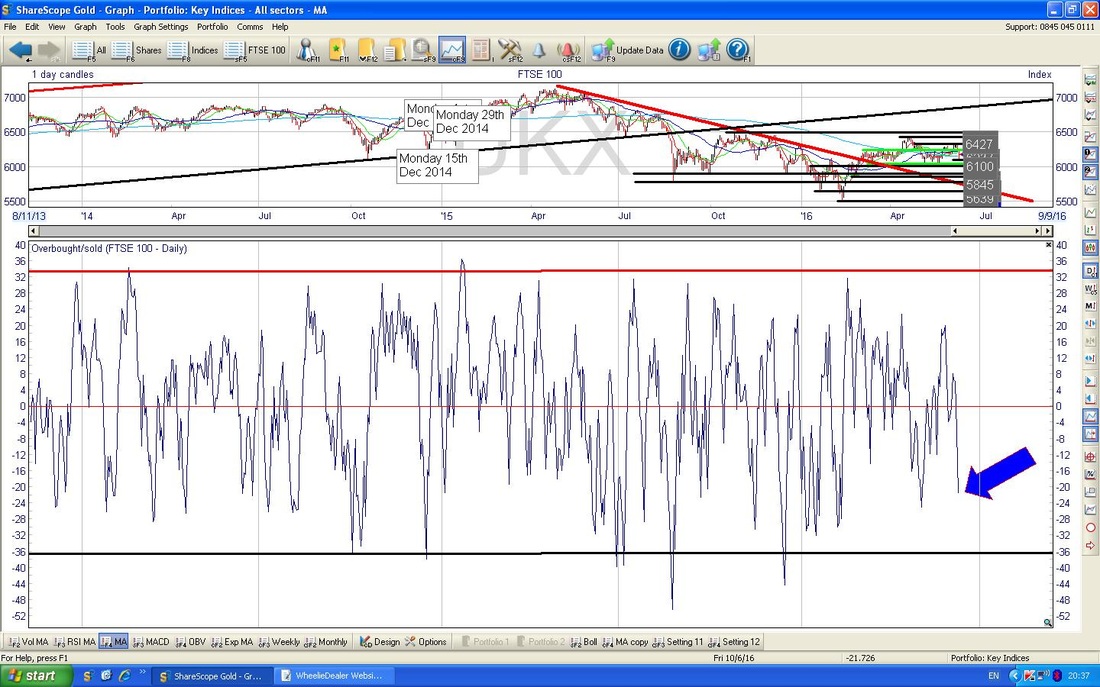
In the Bottom Window below, we have the ‘Overbought/Oversold’ Oscillator - this is a very short term thing but I find it is pretty reliable at predicting Turning Points both at the Top and the Bottom. My Blue Arrow points to where the Indicator is now and you can see it is quite low - it will be interesting to see if we get down near the Black Line at the -36 reading.
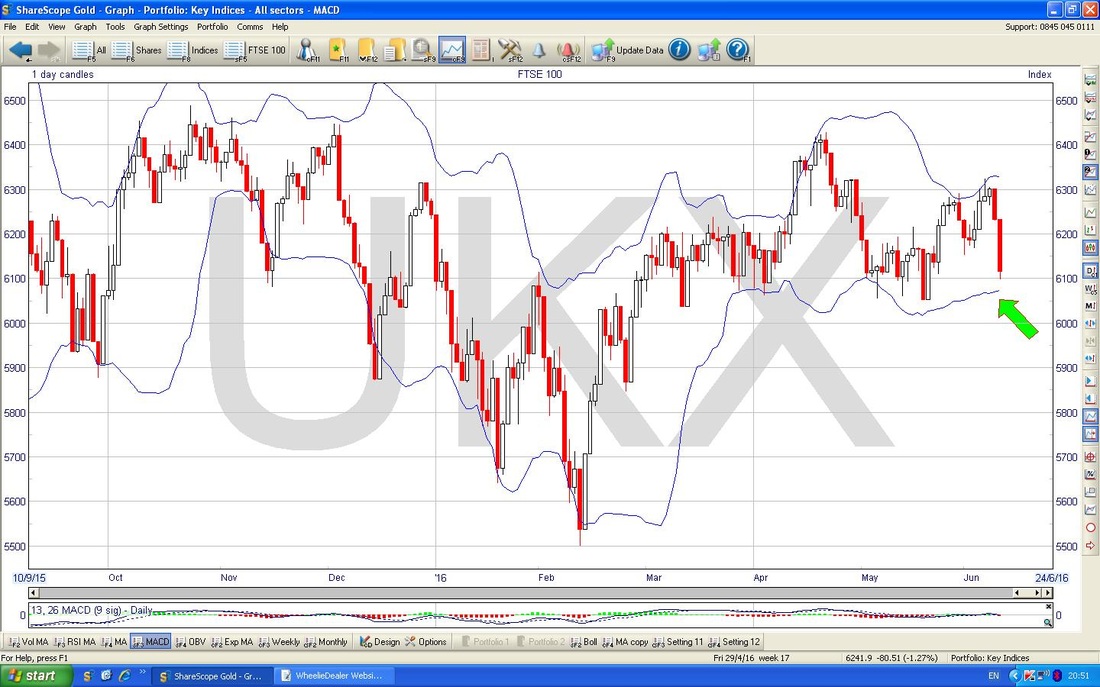
The Screen below shows the Bollinger Bands for FTSE100 Daily. My Green Arrow is pointing to where the Bottom Bollie Band is currently - about 6065 ish. This might act as Support and this is worth monitoring. However, be aware that the Price can ‘hug’ the Lower Band downwards - if you look at the middle of the screen around the turn of the Year, you can see where this ‘hugging’ took place back then.
In the bottom Window below we have the MACD (Moving Average Convergence Divergence) for the FTSE100 Daily. My Black Arrow points to where the Histogram Bars have turned from Green to Red and there is a Cross to the downside on the ‘Signal Lines’ - this is all Bearish.
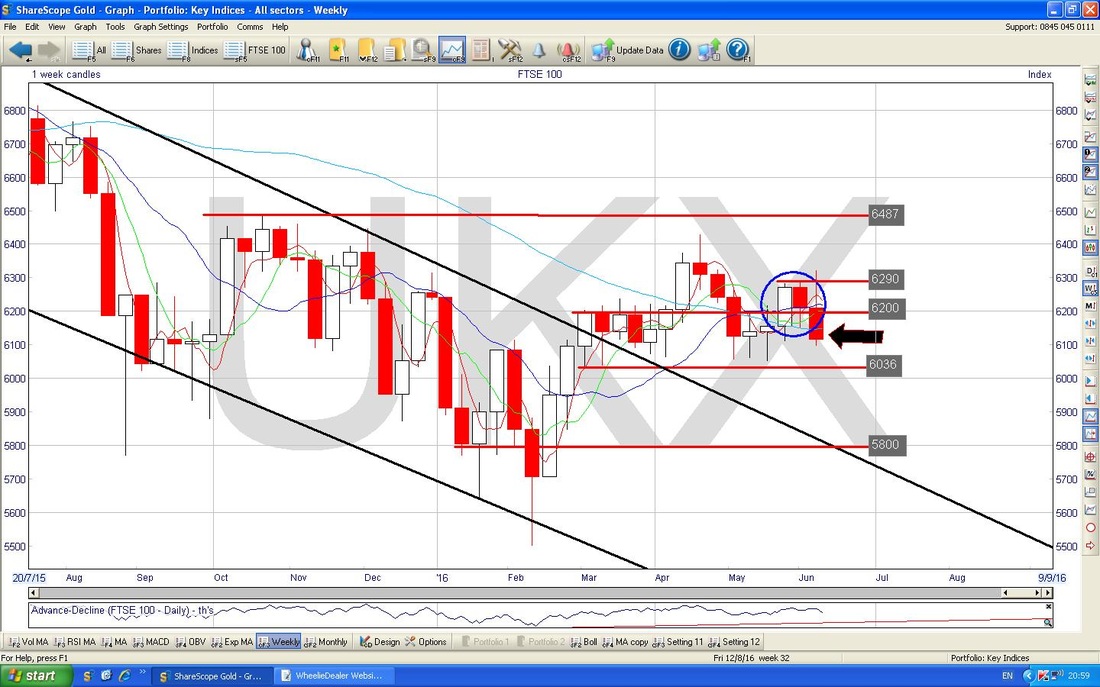
Below we have the Weekly Candles for the FTSE100 - I have put this in because it shows that the Bearish 2-Candle Pattern that I was on about in last week’s update actually was a predictor of a Down Move - if you remember, the Blue Circle encompasses the Bearish Pattern and my Black Arrow points to the Down Candle that followed it.
S&P500
Some ‘Big Picture’ context first. Chart below shows S&P500 Daily Candles going back to the Lows in 2009 and the Rally since. However you cut it, this is flipping impressive and my Blue Line marked with the Blue Arrow shows the All Time High (which is at 2135). So the fact of the matter is that however Bearish we might feel, the truth is that this Index is very much at its All Time Highs. Now, this has 2 possible outcomes - either we are at the Peak and about to Breakout and go higher or we are about to totally ‘Top Out’ and drop down - interesting indeed !! 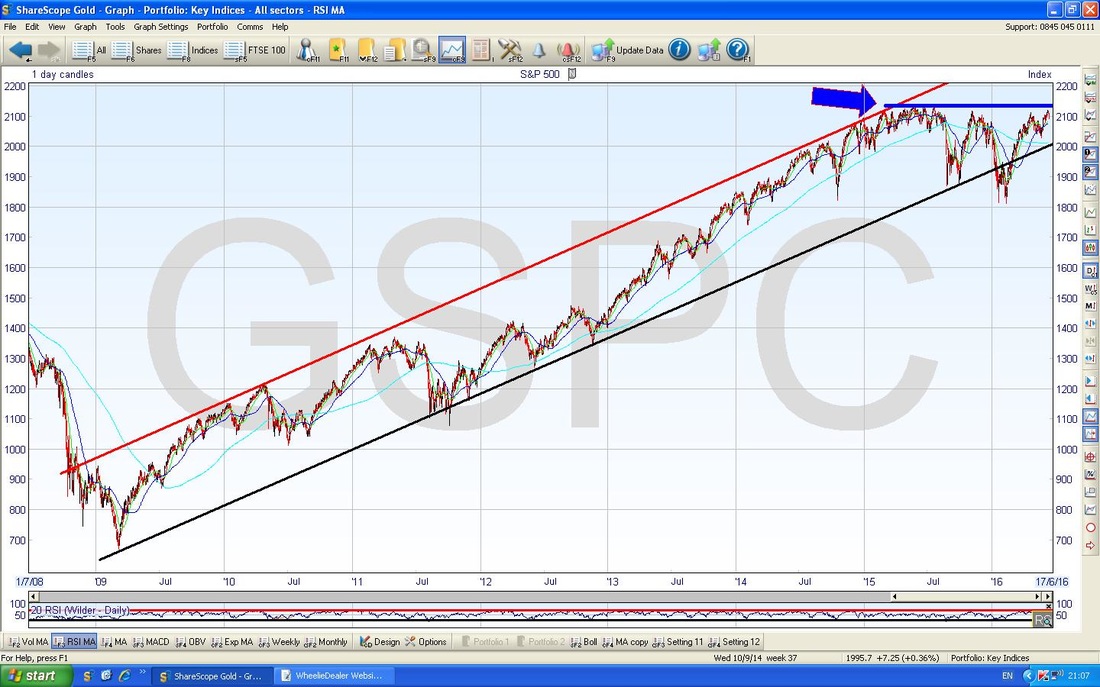
The Screen below shows the Daily Candles for the S&P500 going back about 3 months. I have zoomed in tight because I want to show the Support Levels in a similar way to how I did with the FTSE100 earlier. Note the Blue Box with ‘2090’ in it is the Low that was produced on Friday over in the US and at least the Price managed to close up off the Low of the Day.
My Black Arrow is pointing to the 50 Day Moving Average (Darker Blue Wavy Line) and this might act as Support at around 2075. 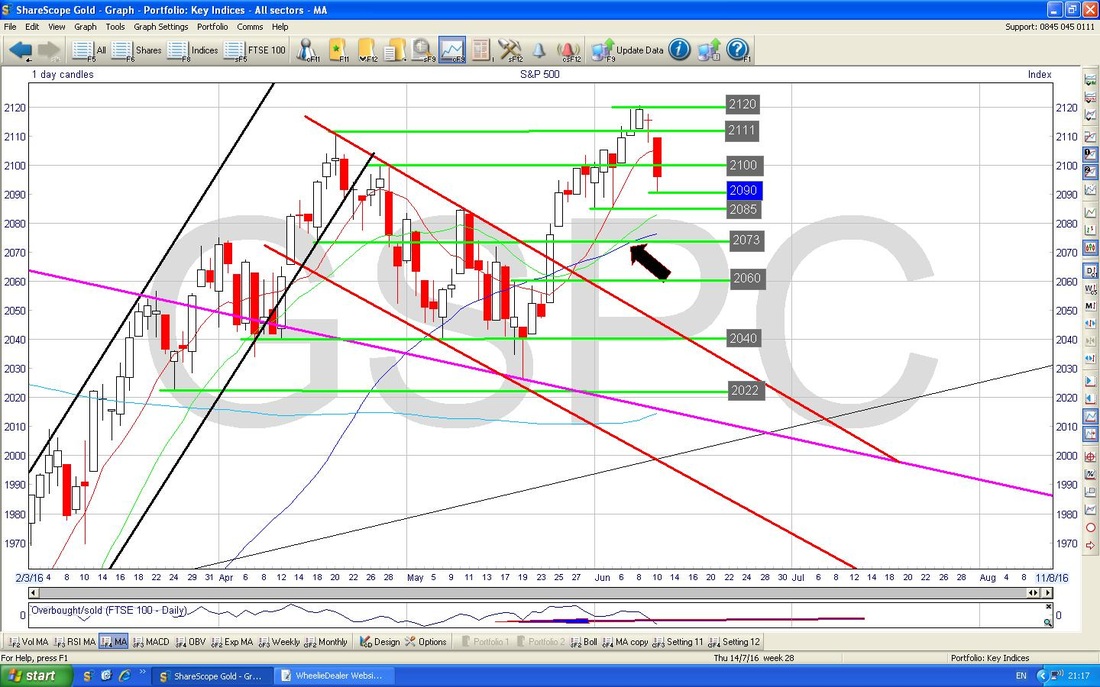
The Screen below shows the Bollinger Bands for the S&P500 Daily. My Yellow Circle is highlighting where the recent Price Action has come down away from the Upper Bollie Band and suggests we might fall more. Note the Bottom Bollie Band is at about 2030 - it we do get a sizeable drop, this might act as Support.
It will be interesting to see if the US does fall and, if so, by how much. I say this because obviously the Brexit is a UK and European issue really - although in this highly interconnected World (with very close correlations between Major Indexes globally) things do tend to move together. 
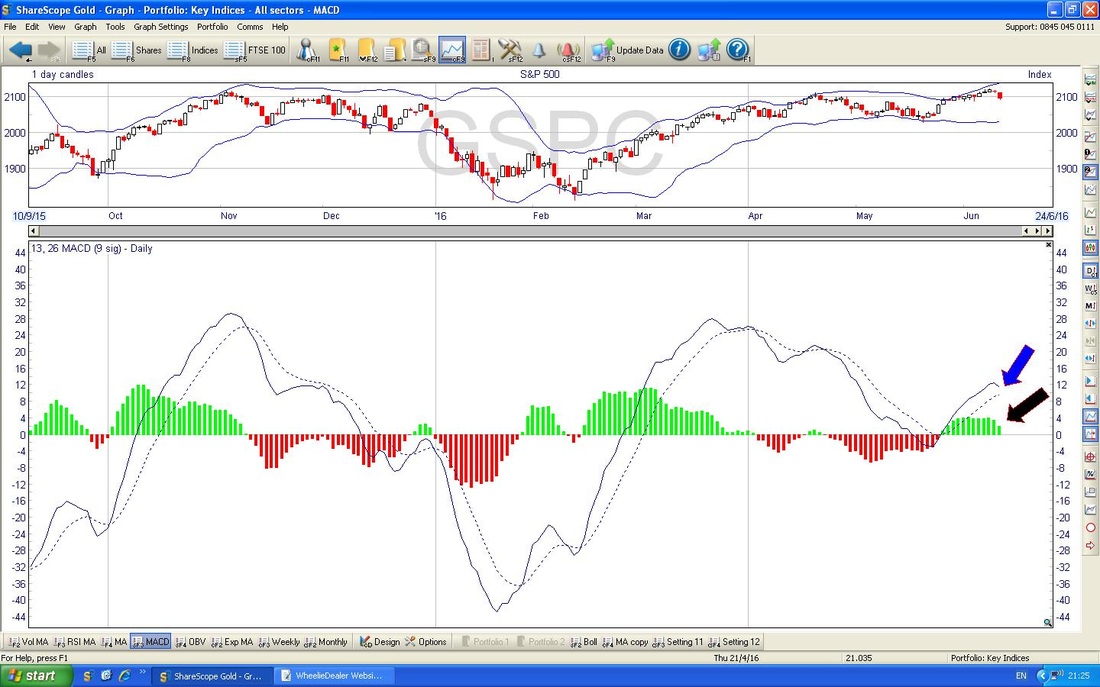
The Bottom Window below has the MACD for the S&P500 Daily. My Blue Arrow is pointing to where the ‘Signal Lines’ seem to be lining up a Bearish MACD Cross and my Black Arrow is showing the same thing in Histogram form - note how the Green ‘Hump’ seems to be rolling over towards going Red.
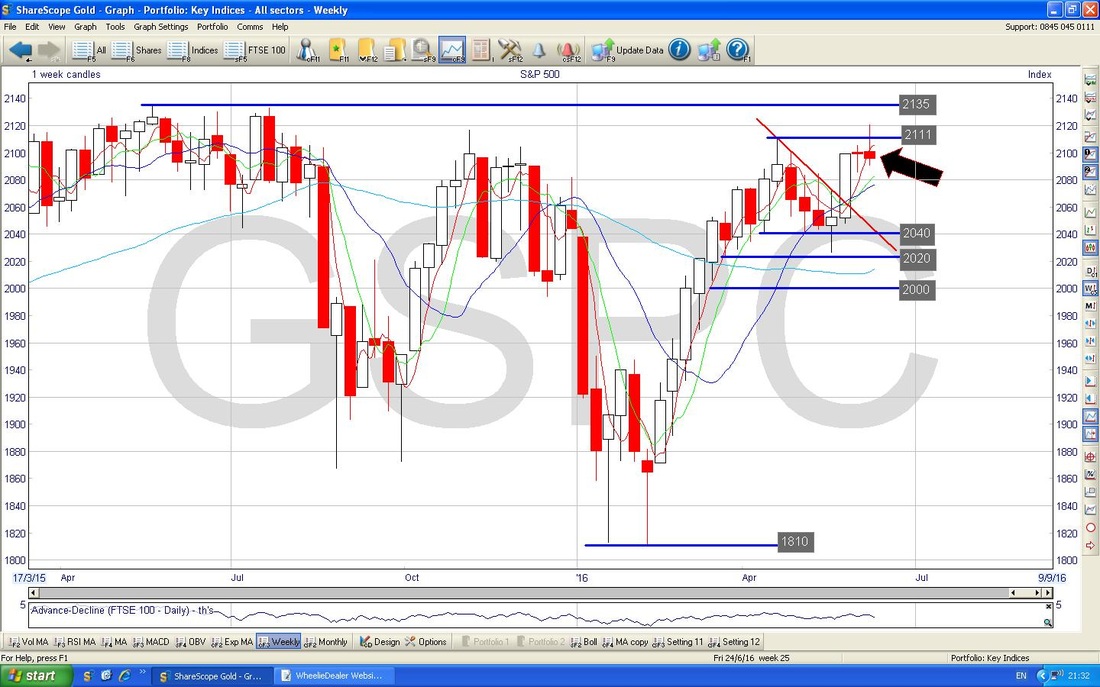
The Screen below shows the Weekly Candles for the S&P500. My Black Arrow is pointing to an ‘Inverted Hammer’ which was banged out last Week - this is pretty Bearish in the context of the recent run up.
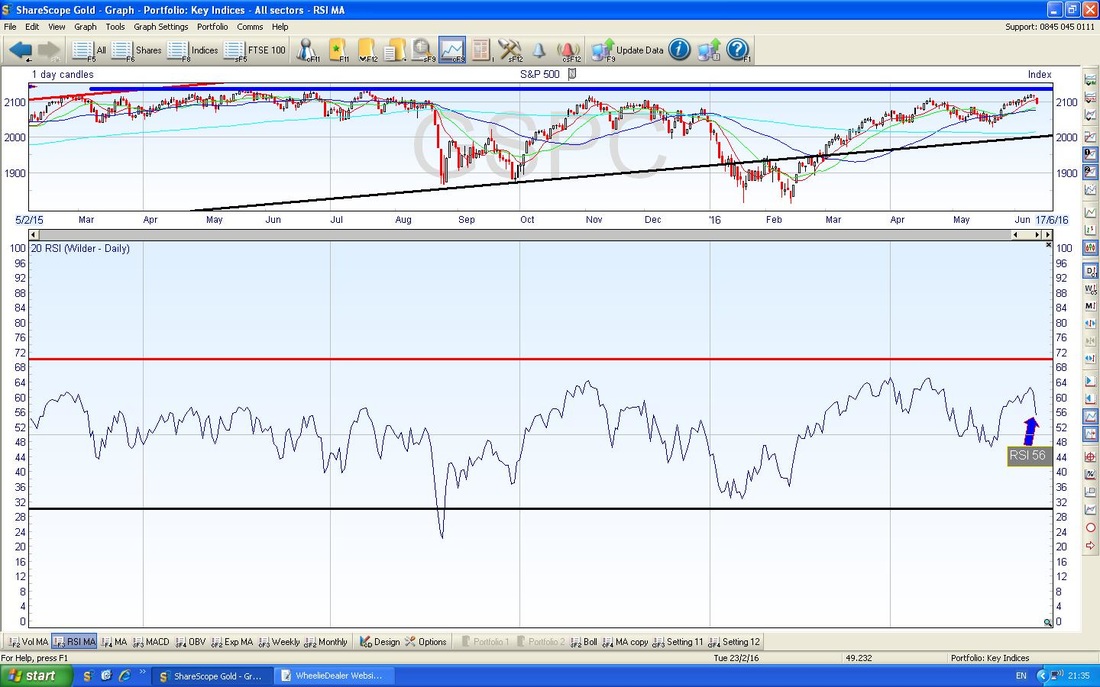
The Screen below has the RSI in the bottom window. A reading of RSI 56 is still on the high side and can drop a long way.
Brent Oil
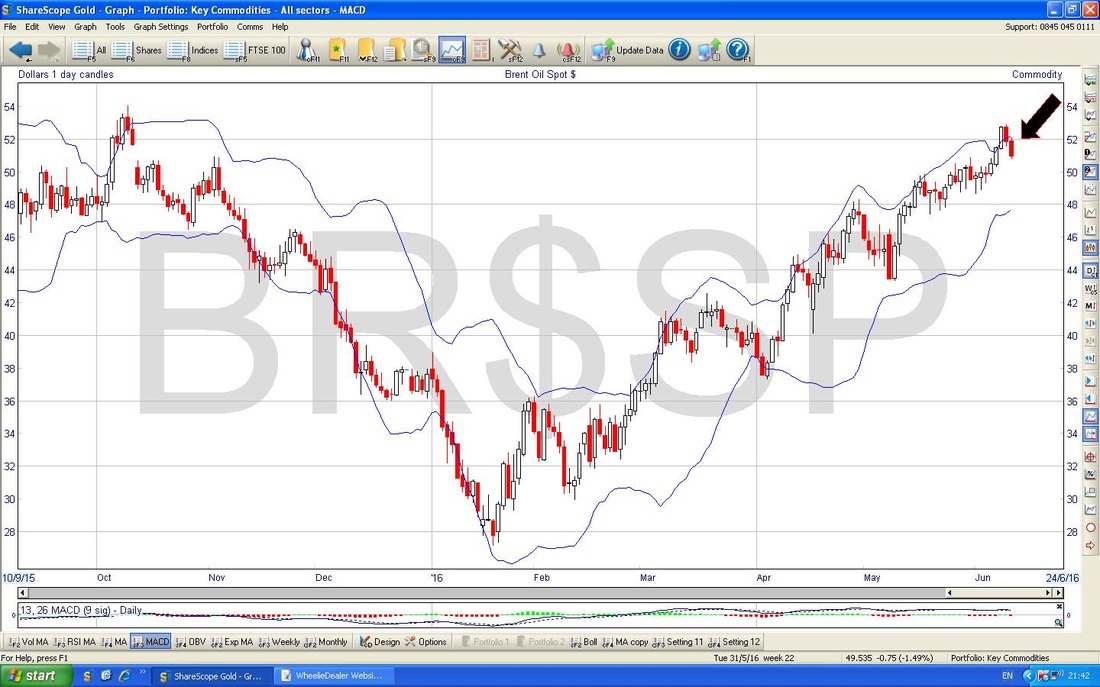
Not a huge change from last week - we are still nicely within the Blue Lines of the Uptrend Channel but clearly turned down off a recent Peak at nearly $53. There is plenty of Support below and a key level will be around $48 which would be the bottom Uptrend Line. $50 may be decent Support as well. To the upside, as with previous weeks, $54 is the Key Resistance that needs to be broken through. 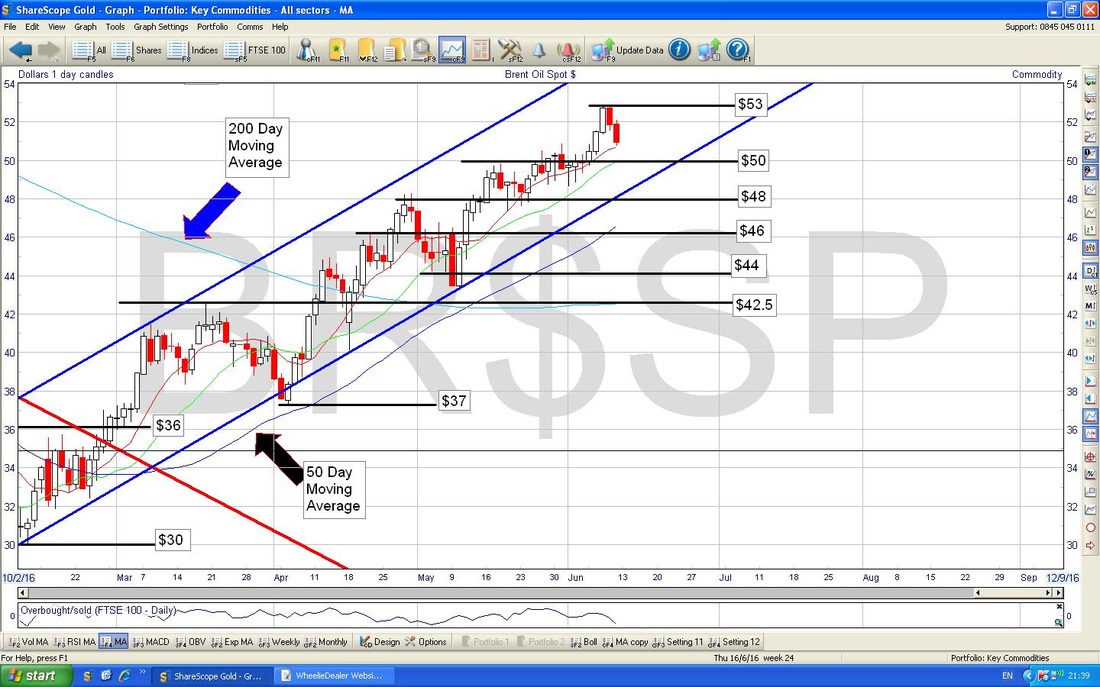
The Screen below has the Bollinger Bands for Brent Oil Daily - my Black Arrow shows how the Price has fallen away from the Upper Bollie band and may drop down towards the Bottom Band - note this is around $48 which is consistent with what I said above.
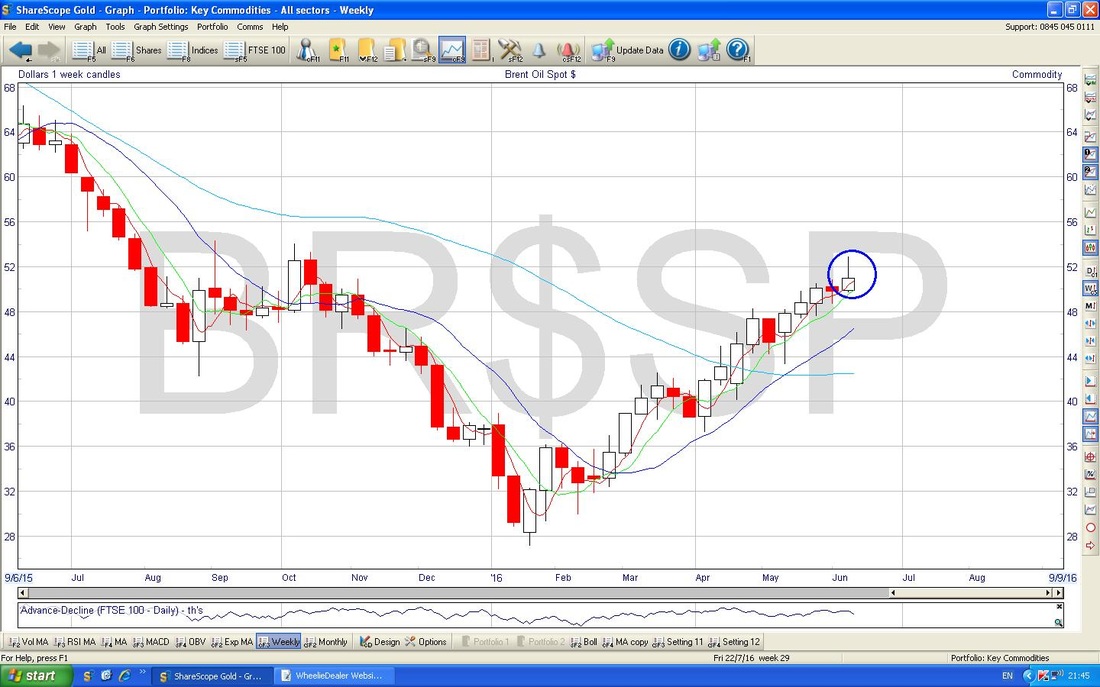
The Screen below has the Weekly Candles for Brent Oil - this is a beauty - my Blue Circle shows an ‘Inverted Hammer’ and in this context of a strong run up over many Weeks, this really looks like a powerful Sell Signal. If we do see a bit of a sell-off in Brent Oil, we might see the FTSE100 come under more pressure to the downside.
Gold
The Screen below has the Daily Candles for Gold going back for most of 2016. On Friday we got an ‘Inverted Hammer’ which looks bearish in the context of the run up in recent Days - I have marked this with my Blue Arrow. There is quite a bit of Support just below at about $1260 then around $1240. Obviously if we are to see more upside (which I would expect if the Stockmarket Indexes go off due to Brexit), we need to crack $1284 initially and then go on to breakout over $1304 - which would be really Bullish. One other thing that hits me about this Chart is that maybe we are looking at a wide ‘Bull Flag’. There was the ‘Flagpole’ created by the run up from the start of 2016 to early February and since that we have gone Sideways which could be the ‘Flag’ bit of it - I hope I’m right. OK, that’s it for now, good luck in the coming week - remember, it could be ‘challenging’ so keep your cool and don’t do anything daft. Constantly looking at the Markets may worry you and spook your emotions - so it is probably best to turn CNBC and Bloomberg off and go and do something much more useful with your life - like cleaning out the Garage or something equally tedious that you have been putting off for years…….. Cheers, WD. 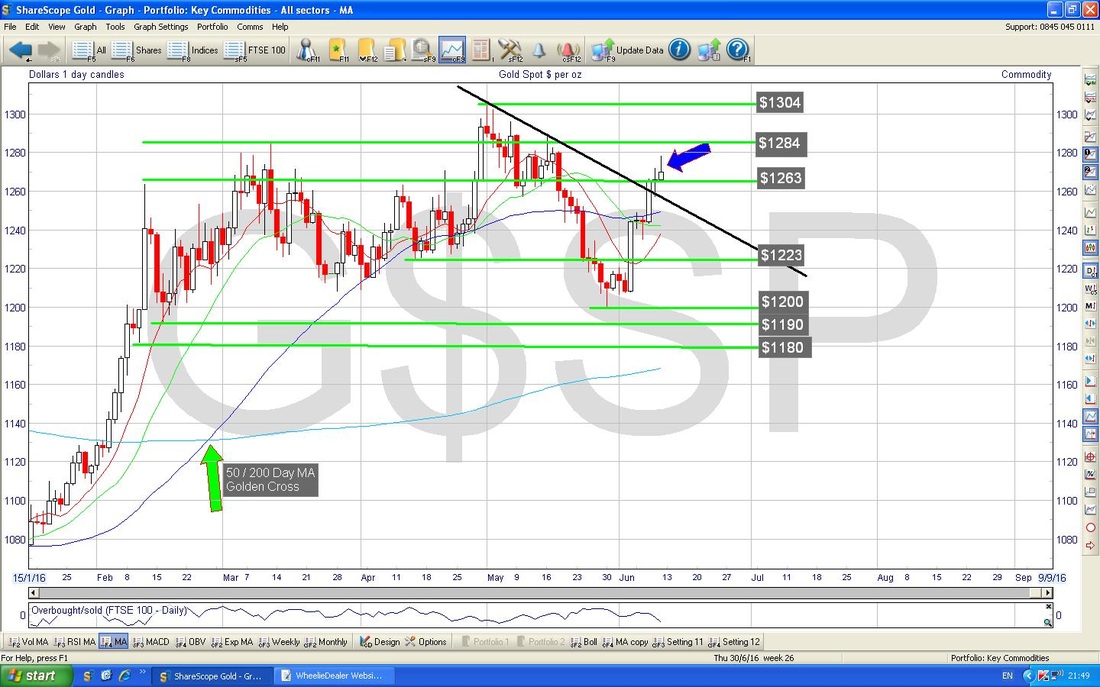
2 Comments
catflap
13/6/2016 12:05:36 pm
"Buyers strike".
WheelieDealer
13/6/2016 08:37:46 pm
Hi Catflap, I think you are right there, a lot of Players will have shorted (like me) and will need to buy back at some point - this can cause very fast rebounds and catch a lot of people out. As I mentioned in my 'Weekly Performance' comments, if anything the trend seems to be heading towards 'Leave' with Polls and Bookies - this suggests to me that the most likely scenario is more downside. I guess the key is 6000 - if this holds as Support then the Markets are obviously not too concerned; if it fails, then it is pretty clear that there is a lot of worry about. Leave a Reply. |
'Educational' WheelieBlogsWelcome to my Educational Blog Page - I have another 'Stocks & Markets' Blog Page which you can access via a Button on the top of the Homepage. Archives
January 2021
Categories
All
Please see the Full Range of Book Ideas in Wheelie's Bookshop.
|
