

|
educational blogs |
|
I wasn’t going to produce this Blog as I have lots of other stuff I want to do to the Website and I really should be cracking on with that. However, I felt that by bashing out this text it might help me think clearly about the FTSE100 Short I have in place - one of the superb side-effects of all this Blogging is that it forces me to think very carefully about any trades I undertake or hold. Thought for all readers - how about making your own blogs? So what if no one reads it, just the process of writing things out clearly will make you a better investor I suspect. With stunning FREE website offerings like weebly.com, the ability to Blog has never been easier. If people read my cr*p then I am sure they will read yours !! How did I get into this pickle? You may recall that back in the horrible dark days of mid October I put on a FTSE100 Short position to ‘Hedge’ a chunk of my Portfolio at about 6100 - I could not have timed it worse !! If you dig through my Blogs there is a Rationale for the trade - probably made great sense at the time, but now it is a pain in the arse as the market moves up seemingly endlessly (ha ha, don’t be fooled, it will end). It is definitely a failing of mine to get Spooked by the Market and panicked into these kind of actions. Luckily, I am only Hedged to about 35% of my overall Long Exposure - so 65% is still benefiting from the upside in markets. The main reason for this Hedge was practical - if I had not Hedged and the market had continued to fall, then I would have had Margin Calls on my Spreadbet Long Exposure and would have had to put cash into my igIndex account - I have the cash to do this, but I would rather not burn it if I can avoid that. But there is no doubt I need to get better at this Hedging malarkey - I remember a couple of years ago I got really caught by it and took a Big Loss - and we don’t want those, do we. Although in that case the Market had clearly ‘Broken Out’ and I had the good sense to close the Short and take the hit. This time I think things are different as I will explain below - 6900 ish has extremely strong resistance and puts a cap on the upside in my view (Wheelie, you just said “this time it’s different”…….)* Related to that, let me just stress that on my Long Spreadbet Exposure I hold an enormous reserve of Cash to back it up - I could probably get hold of 60% of the overall Spreadbet Exposure as Cash if I needed to - and my Overall Assets are far higher than my Normal Stocks and Spreadbet Exposure combined - it is very important to keep Leverage under control and not get carried away. I recommend that any New Investors and even fairly experienced Investors stay away from Spreadbets similar Derivatives on the whole. They can kill. In order to avoid being Spooked in future - I think I need to almost shut out the World (particularly CNBC and Bloomberg TV which just add to my Fear) and just focus on the Charts - if the RSI is silly low like 30, then I should not be Selling, I should be Buying. Conversely, if the RSI is high around 70, then I should be Selling, not Buying. Being cold, rational, logical and ‘Trading what I see’ is probably the way to be - however, that said, it is extremely hard to do in practice. Part of this is the Leverage of Spreadbets - the need to supply Cash in Margin Calls adds a psychological pressure - maybe my Spreadbet Long Exposure is too high………hmmm…….. What Action should I take now? Where was I? Right, the nub of the issue is what should I do with the FTSE100 Short now? Well, after the recent superb run up, markets are definitely looking Toppy - so it strikes me that this is not the time to Close my Short (effectively ‘Buying’ the FTSE100 - the opposite of a Short). If anything, this is the time to be ‘Selling’ the FTSE100 - i.e. maybe I should add to the Short…….decisions, decisions…….. Let’s look at a chart - I have shoved in below a Screenshot showing the FTSE100 Price Line in the Top Window and the RSI (Relative Strength Index) in the Bottom Window. There are loads more Charts and Indicators I could add but this is supposed to be a Short Blog so I will stick with just this one. Support and Resistance If you look at the Top Window, I have put in the Strong Resistance around 6900 with a Thick Red Line right at the top. This is an area that has been tested many, many times and has not been broken through ever in history - so it is unbelievably strong Resistance. I expect it will be broken in time, but I doubt it will happen in the next few weeks - maybe we will see it early 2015 - but even that would surprise me - especially as the Global Economy seems to be pretty lacklustre and there is a General Election in May. We are approaching this level as you can see (currently 6750). If you look lower down the Top Window, you will see a Thick Black Line - this marks an area of Very Strong Support - I love this because I think it puts a very strong Floor under the FTSE100 - any moves down towards here will most likely recover upwards - so perhaps we should be buying if we see 6100 - 6200 ish on the FTSE100. I really think the Floor is extremely good news - it will have a very powerful effect. An extrapolation of the above Support and Resistance Levels, makes me lead to the conclusion that maybe we are in a Big Trading Range between 6100 to 6900. Handy to realise. Buy at the bottom, sell at the top - Simples !! (yeah, right….). And for you real charting geeks - maybe this is a big Bull Flag…… By the way, a Breakout above 6900 and especially the psychologically important 7000 would be an incredibly Bullish event - we should see a rapid acceleration upwards if these levels are broken through. This would draw a lot of Retail Investors in who have been avoiding the Stockmarket for years - we could have an amazing Bull Market in that case. It would also probably end in lots of tears….. The Blue Line at the bottom marks roughly where I opened my Short - as you can see, my timing could not have been any worse !! Doh !! 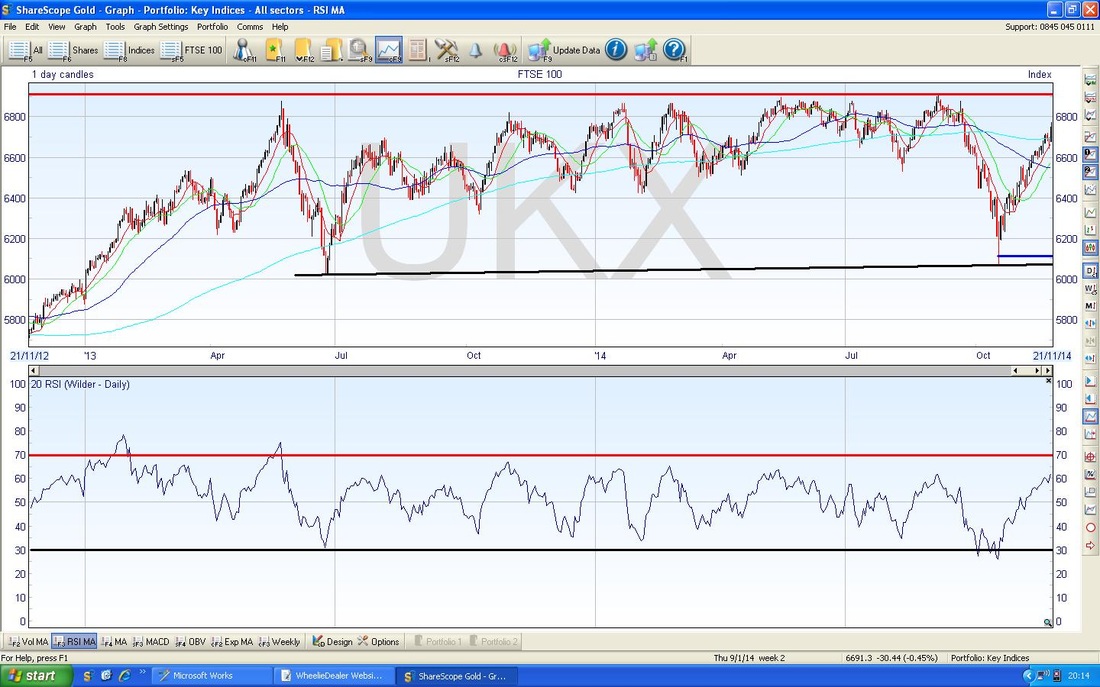
RSI
If you look at the Bottom Window now, you will see how the RSI Indicator wiggles between roughly 30 (marked with a Thick Black Line) and 70 (marked with a Thick Red Line). Look now at how the Low Points on the FTSE100 Price Line in the Top Window, coincide with readings near 30 in the RSI Window. Similarly, look at how the Price Line matches to high RSI readings near 70. Clearly from this you can see that we are getting near ‘Overbought’ levels, and it is obvious that the recent rally cannot be sustained for much longer. Conclusion These are just a couple of simple Technical Timing tools which suggest that we are getting toppy on the FTSE100. In combination with other Indicators, I have decided to stick with my Short and if I see 6900 or close to it, I will open a slightly bigger Short Position - but I will not go mad. I am very pleased that the Short is working quite well - the Short seems to offset the Long Spreadbets pretty well - which is often a challenge as obviously my Longs are made up of a variety of different stocks from different size areas of the market (like Small Caps, FTSE250, FTSE100 etc.) - although I am possibly being complacent here - chances are that in a falling market, my Hedging would not work as well. It would however reduce my requirement to fund Margin Calls with cash. Holding a Short has a hidden cost - there is a small Interest Charge every day - so I would really love to unwind the Hedge ASAP. There is a strong likelihood of a Santa Rally around Xmas and I would dearly love to have unwound the Hedge by then - we shall see. If I cannot manage this, then there is a General Election in May next year and it is obvious this will cause huge Uncertainty - there has probably never been a less clear outcome before an Election in my lifetime - and I am knocking on a bit now…… Finally, I must add that scribbling this diatribe has helped my decision immensely - thanks peeps !! Probably see ya on Monday with a new Blog…… wd * It’s a classic Stockmarket joke (not a very good one, I admit) - if someone says “this time it’s different”, the counter to that is “it is never different”. In the Tech Boom, all you would hear is “this time it’s different” to explain why Valuations could be utterly bonkers. Time and Reality clearly showed that it was not different and that Bubble ended just like all the others.
0 Comments
Leave a Reply. |
'Educational' WheelieBlogsWelcome to my Educational Blog Page - I have another 'Stocks & Markets' Blog Page which you can access via a Button on the top of the Homepage. Archives
January 2021
Categories
All
Please see the Full Range of Book Ideas in Wheelie's Bookshop.
|
