

|
educational blogs |
|
Blimey, start of May already - a third of the Year gone and we are heading towards Summer. As usual on a Sunday Night, I will have a run through some key Charts after first consulting the Almanac. I suspect the FTSE100 Weekly will tell us a fair bit about the most likely direction and I know that Gold has done a very bullish looking Breakout. Don’t forget the UK Markets are closed tomorrow for a Bank Holiday but I believe the US will be trading as usual. I notice from the Almanac that Japan is closed on both Tuesday 3rd, Wednesday 4th and Thursday 5th of May - at least that will stop the NIKKEI falling for a bit !!
According to the UK Stockmarket Almanac 2016, the coming Week has been Up for 66% of Years with a positive Average Return of 0.5% - so it looks to be mildly positive usually.
Obviously we are leading into May and this tends to be the 3rd Weakest Month of the Year being up on 50% of Years with an Average Return of MINUS 0.2% - this is notable because since 1970 May is one of only 3 Months to give a Negative Return on the Month - the others are June and September. Note also that since 2000 the Average Return has got worse with MINUS 0.6%.
An Average May tends to be flat for the first 2 Weeks and then to slide for the last 2 Weeks. May is the Weakest Month for relative performance of the FTSE100 against the S&P500 - on average FTSE100 underperforms by 1.9%. With the “Sell in May and forget about it until September” saying being pretty well established, it is no great shock that May is often a bit ropey. In addition, of course we have the Brexit Vote this year on June 23rd and I cannot see how the Market can make any headway against such a backdrop. Thinking about this in technical terms, it strikes me that there will be a distinct lack of Buying Pressure as most people will be waiting to see what the outcome of the Vote is - and at the same time, even if Selling Pressure is just the normal for this time of year, Markets are likely to drift downwards. If People decide to Sell even more, then Prices are likely to really fall a fair bit. I doubt Prices will recover until after the Brexit Vote has been held - whatever the outcome - Markets like certainty. (No, you are not going mad, the last 3 paragraphs are a direct copy of what I put in last Week’s Blog but are clearly still relevant.) FTSE100 Something to note here is that the Brent Crude Oil Price looks like it may fall this coming Week - this may drag on the FTSE100; I will show you what I mean in a bit. As promised, here is the Weekly Candlesticks Chart from the sublime ShareScope software - this looks quite bearish as I will explain. My Blue Arrow is pointing to a Down Candle that was produced Last Week and this ‘confirms’ the Inverted Hammer Candle which was produced the Week before - this is text-book Candlestick behaviour and suggests that the Inverted Hammer was marking a Turning Point where the direction has reversed to moving Downwards. Bearing in mind that the Price was getting up near that 6487 Strong Resistance Line - it is no great shock that it has turned down. 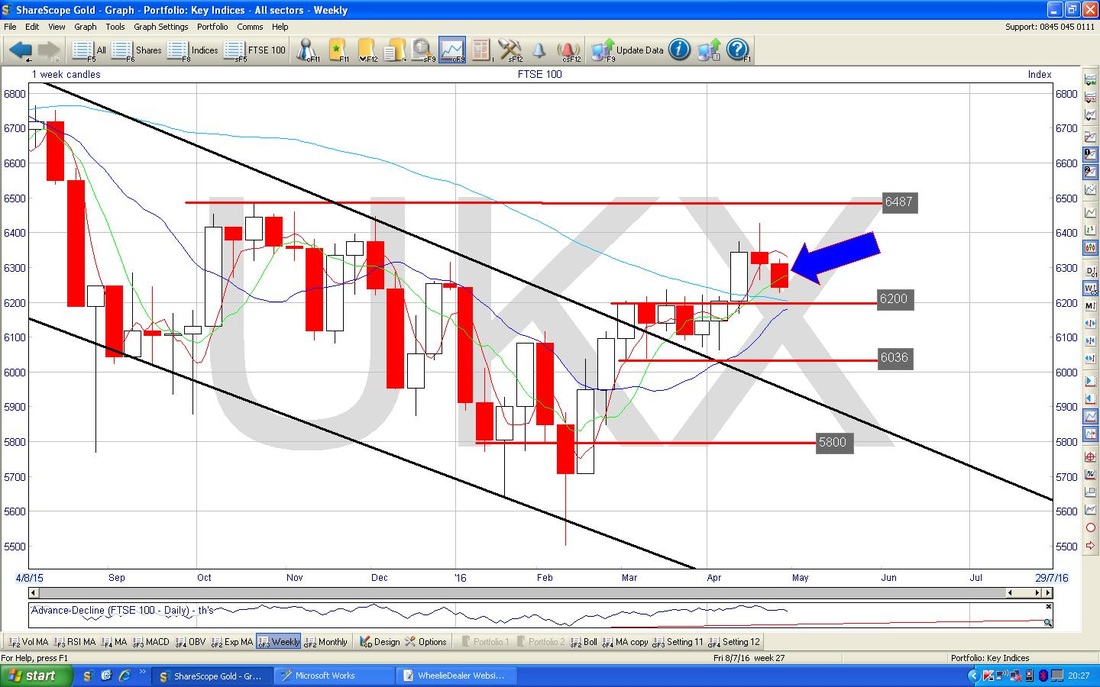
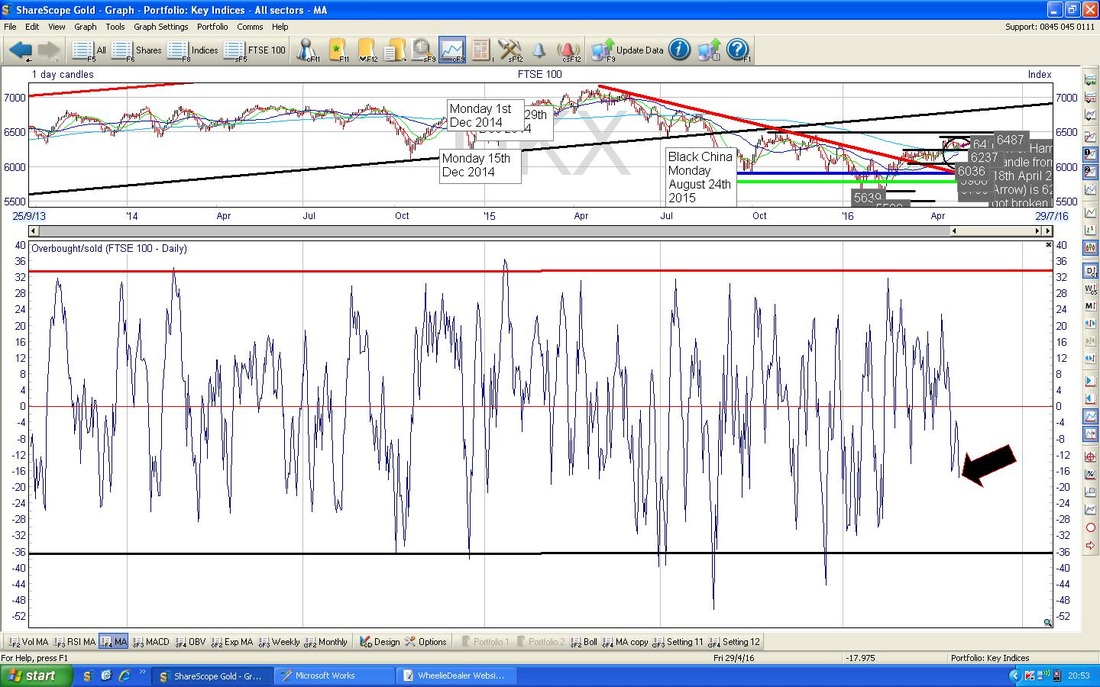
The Chart below has the Daily Candles over about 6 months - my Blue Arrow is pointing to a Big Red Down Candle from Friday - this is obviously Bearish particularly because it closed at its Lows of the Day and note it also closed below the Intraday Low from the Hammer Candle on Monday 18th April which is marked with the Green Arrow.
Note there is quite a decent Band of Support just below where the Price is now - running roughly between 6036 and 6237 - this might save the day for Bulls. My small Black Circle is pointing out where the Darker Blue Wiggle Line 50 Day Moving Average is on the cusp of doing a Bullish ‘Golden Cross’ against the Lighter Blue Less Wavy Line which is the 200 Day Moving Average. Normally this would be a Bullish event but with the 200 Day Moving Average still falling it might not give the result Bulls want - it is something to watch, however, Golden Crosses do occasionally fail or sometimes we get a Golden Cross but the 50 Day Moving Average very soon falls back through the 200. 6487 is a Strong Level of Resistance above and the failure to make headway at 6427 means that this has now become a Resistance Level as well - so if we do turn back up, there are obstacles just above. Note, I opened another Short FTSE100 Position on Thursday and I have set a Manual Stoploss at 6525 - i.e. just a bit above the 6487 Strong Resistance - if this gets broken through, then the Bulls will be very much in command (see my ‘Trades’ page for full details). I could of course have placed my Stoploss just above 6427 but I wanted to give the Trade more ‘wiggle room’ - mainly because I expect the Brexit Vote to cause all sorts of gyrations over the next 2 months and I want protection. If the Band of Support just below the current Price fails, then it is possible that the Red Sloping former Resistance Line will now become Support - the only catch is that this may not kick in until the Price drops to 5800 or so. 
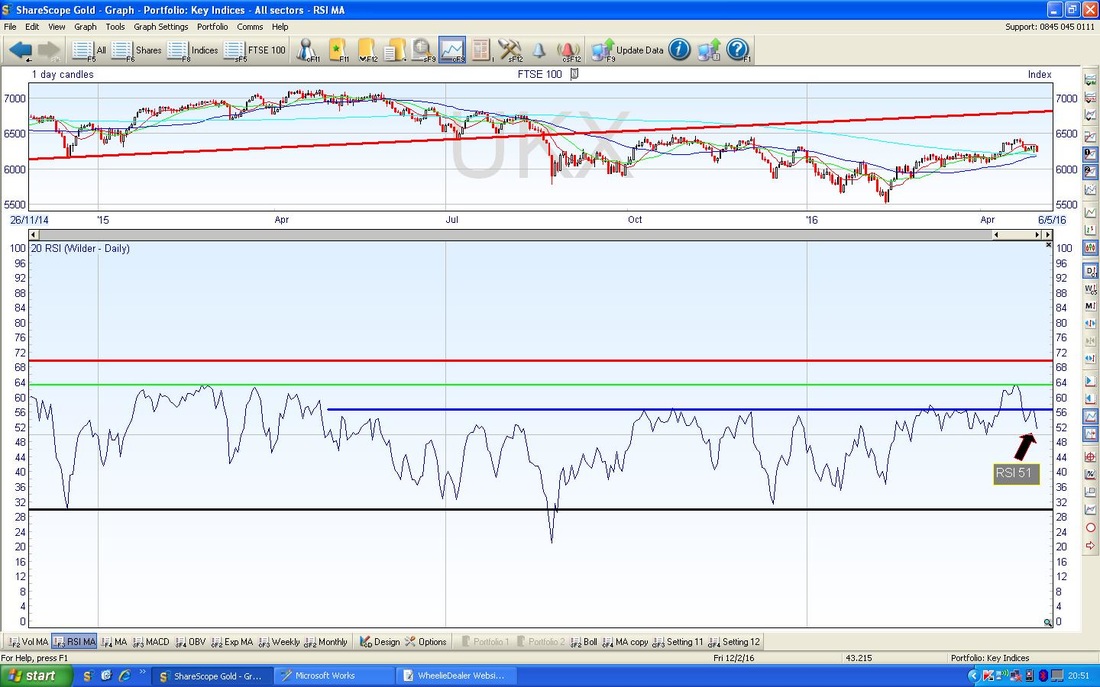
The Chart below in the bottom Window has the Relative Strength Index (RSI) for the FTSE100. It is currently reading about RSI 51 and has dropped off from the Highs - note how the Green Line of Resistance held almost exactly. Usually a move below the Neutral 50 level is seen as negative - so this is worth watching.
The Bottom Window of the Chart below has the Overbought/Oversold Oscillator Indicator thing - note my Black Arrow suggests this is pretty Low so we may get a bounce soon. This is however a very Short Term Indicator and not hugely reliable - so we may get a move up for a couple of days but then turn back down again. There is still room for the OB/OS Indicator to drop a bit more before turning back up.
DAX
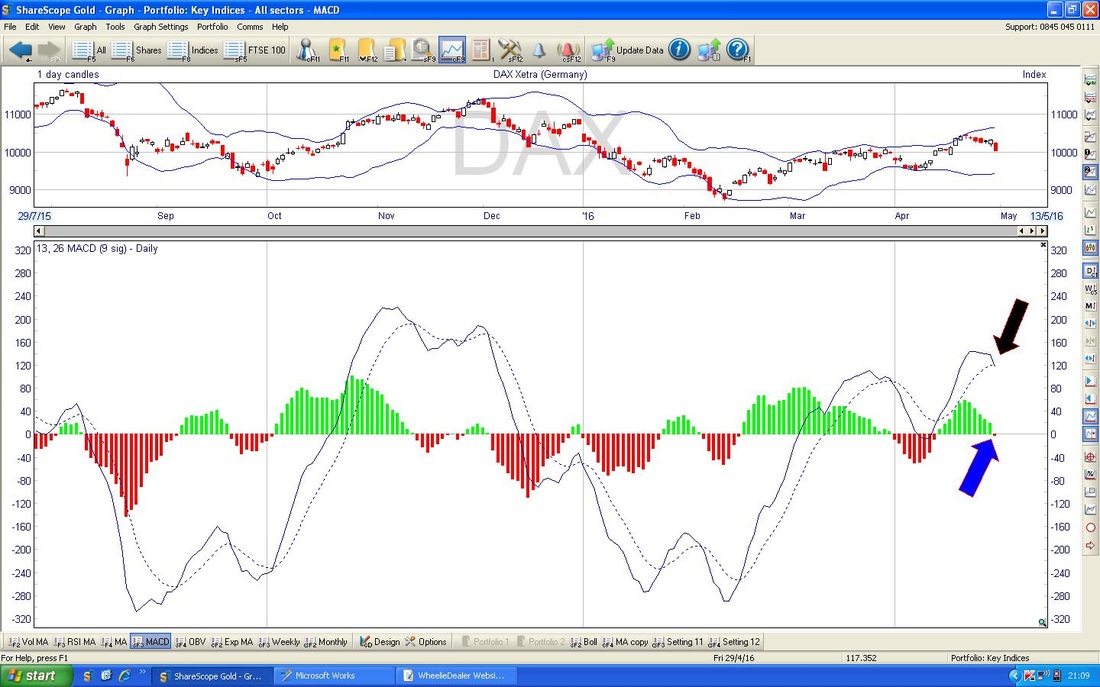
The Chart below shows the German DAX Index over around the last year - note my Green Arrow pointing to the falling Light Blue Wavy Line which is the 200 Day Moving Average - this denotes a Major Downtrend. My Black Arrow is pointing to a Big Red Down Candle which was created on Friday and it really looks like the Price is doing a ‘Retracement’ within the Short Term Uptrend within my Blue Parallel Lines. I would say the Price needs to stay above 9800 which would keep it within the Blue Lines but if it drops below this that would be pretty negative but there is a lot of Support around 9500. 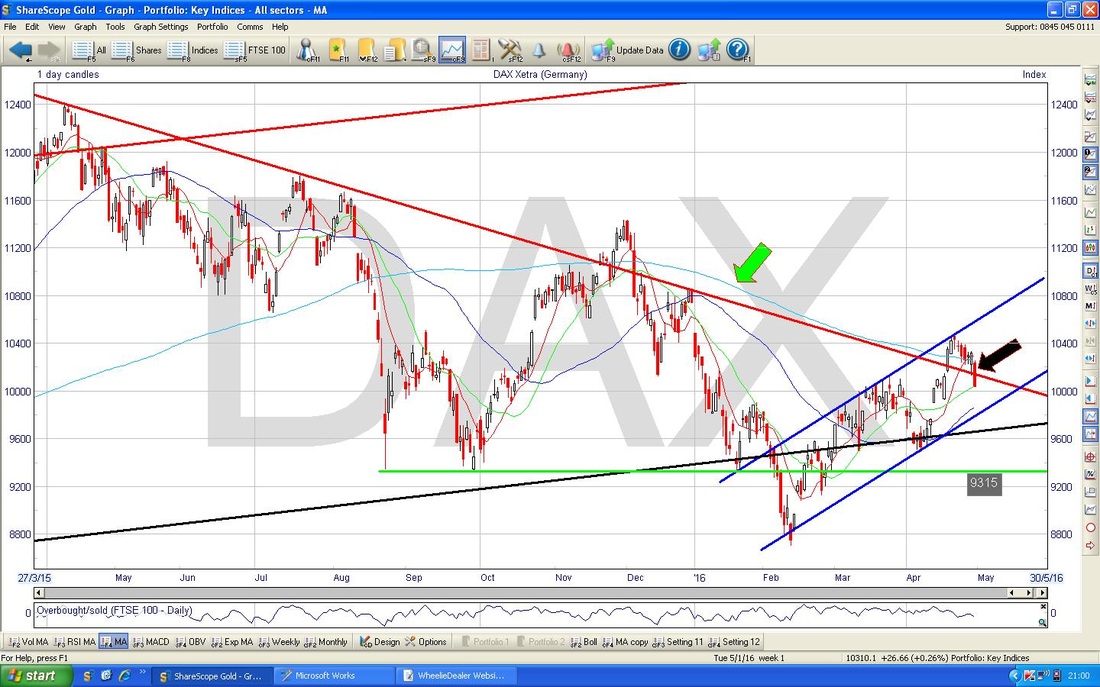
The Bottom Window of the Chart below has the MACD (Moving Average Convergence Divergence) for the DAX - note the Bearish MACD Cross - this is shown in the Green and Red Histogram ‘Humps’ marked with the Blue Arrow and the Black Arrow shows the Bearish Cross in Line form.
S&P500
The Chart below shows the Weekly Candles going back for a bit over a Year. My Black Arrow is pointing to a Red Down Candle that was created last Week and this confirms the Inverted Hammer from the Week before - so that looks Bearish. Note however, that the Candle from last Week is quite ‘messy’ - it has fairly long ‘Wicks’ or ‘Tails’ which suggests that despite it being a Down Week, the Bulls were fighting back hard. My Red Arrow shows where there is a 50/200 Day MA Golden Cross - but my Black Circle at the end of 2015 shows where a Golden Cross occurred but then failed not long afterwards - this is what I was on about earlier with regard to how Golden Crosses can ‘fail’. 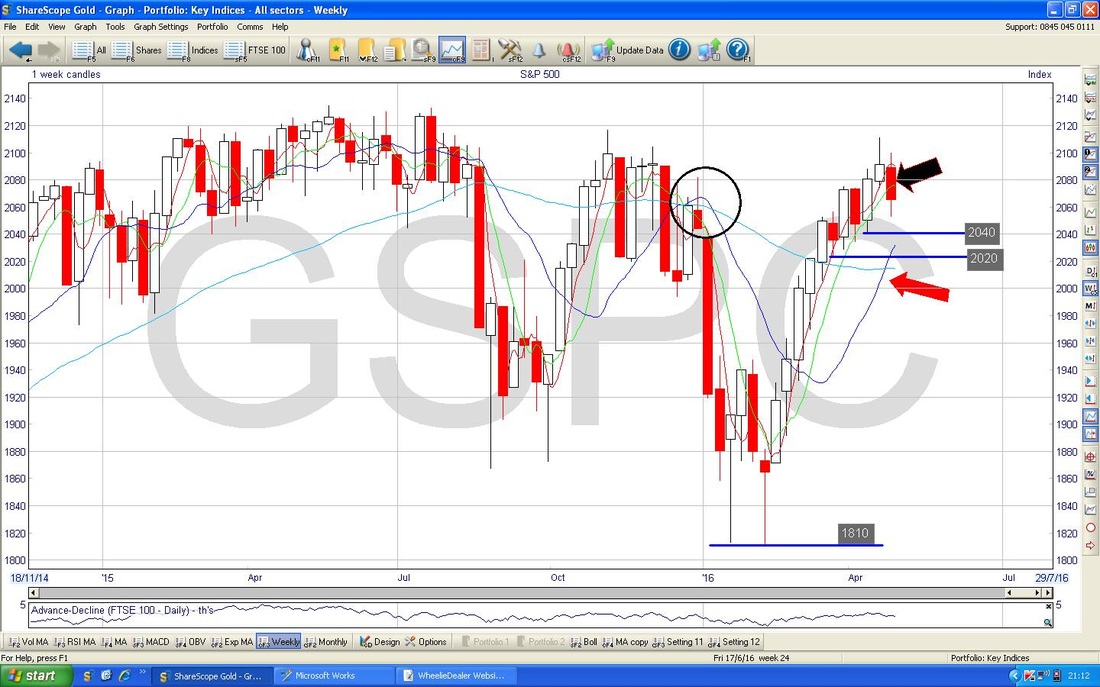
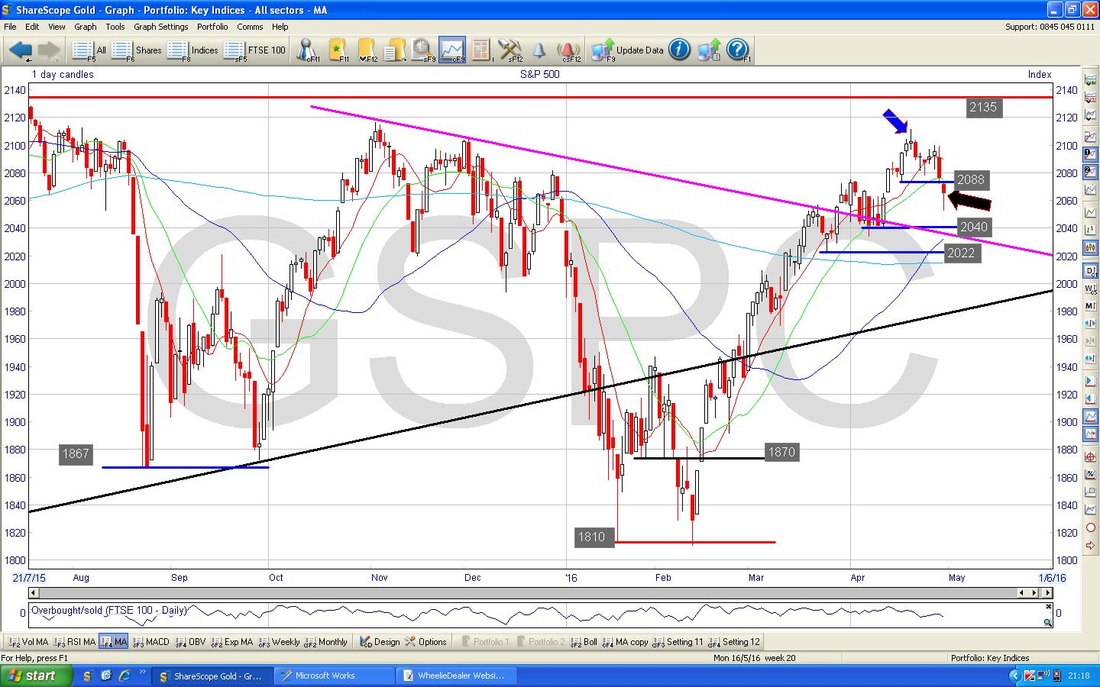
The Chart below has the Daily Candles for the S&P500 - the Main US Index as far as I am concerned. My Black Arrow is pointing to a Hammer Candle that was generated on Friday 29th April - this shows an Intraday Reversal where the Bulls came in after a shaky start - it suggests the US Markets may rally a bit this week but of course it is hard to know how high they can go. Clearly there is huge Resistance above as we are approaching the All Time High (2135) and 2111 before that which was the Intraday High on the Inverted Hammer marked with my Blue Arrow. Note how that Inverted Hammer did predict the subsequent moves down.
Brent Oil
The Chart below is of the Daily Candles for Brent Crude Oil. My Green Arrow is pointing to an Inverted Hammer Candle which formed up on Friday and suggests we may see the Price move down in the Short Term. However, my Blue Parallel Lines Uptrend still looks pretty good at corralling the Price. Note the 200 Day Moving Average is still falling - so we are still in a Major Downtrend, but keep an eye on the 50 Day Moving Average as we are not far off a Bullish Golden Cross. Any sustained weakness now would probably mean a Golden Cross gets narrowly missed out on. There is a lot of Support just below the current Price at $46, $45, $44 etc. My Big Black Circle in the Left Hand Corner of the Chart shows a lot of Resistance just up above the Price. $54 will be a very difficult level to get above. 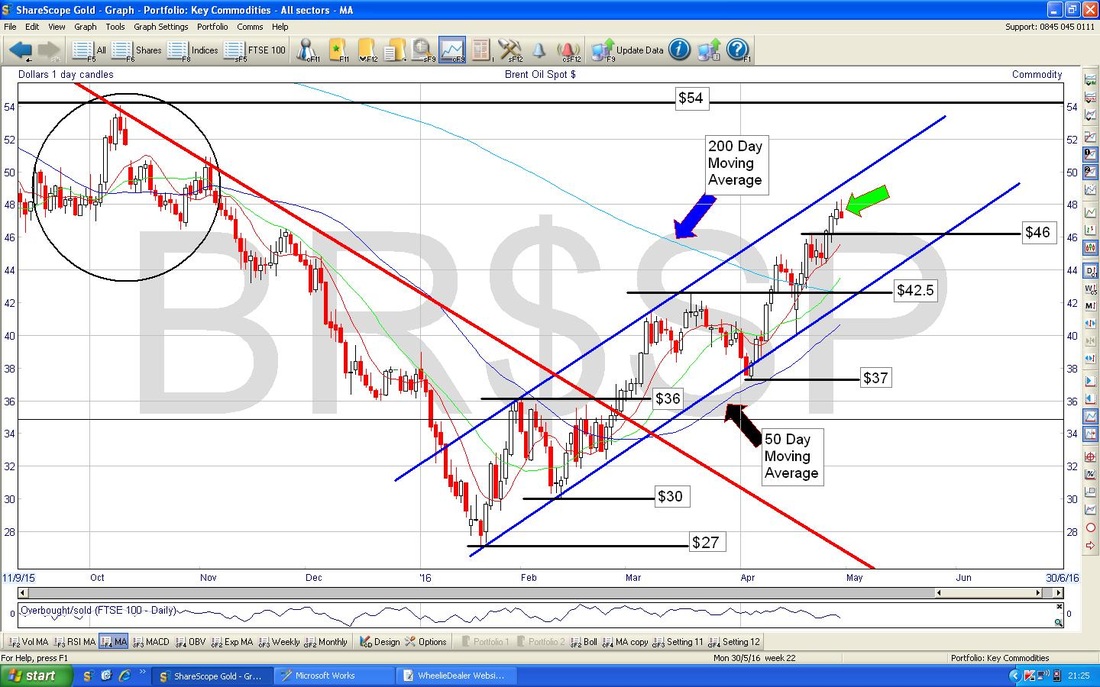
In the bottom Window below, we have the RSI for Brent Oil. My Blue Arrow points to where the RSI is now and it reads about 66. If you look to the left you can see how the Price turns down whenever it gets up to these kind of levels - so it does seem to support the Short Term Bearish view from the Daily Candles.

Gold
This is a thing of beauty - the Chart has the Daily Candlesticks going back for all of 2016. My Black Arrow is pointing to a Big White Up Candle from Friday 29th April where the Price ‘Broke-out’ from the $1284 Resistance Level - this is extremely Bullish and I expect the Price to move up fast now. We may get a pullback to the $1284 Line in coming Days and it should act as Support - this would ‘confirm’ the Breakout. It is possible that the Breakout fails, but I suspect Gold is where Bulls need it to be now. I have no exposure to Gold for various reasons - I may have to buy in. 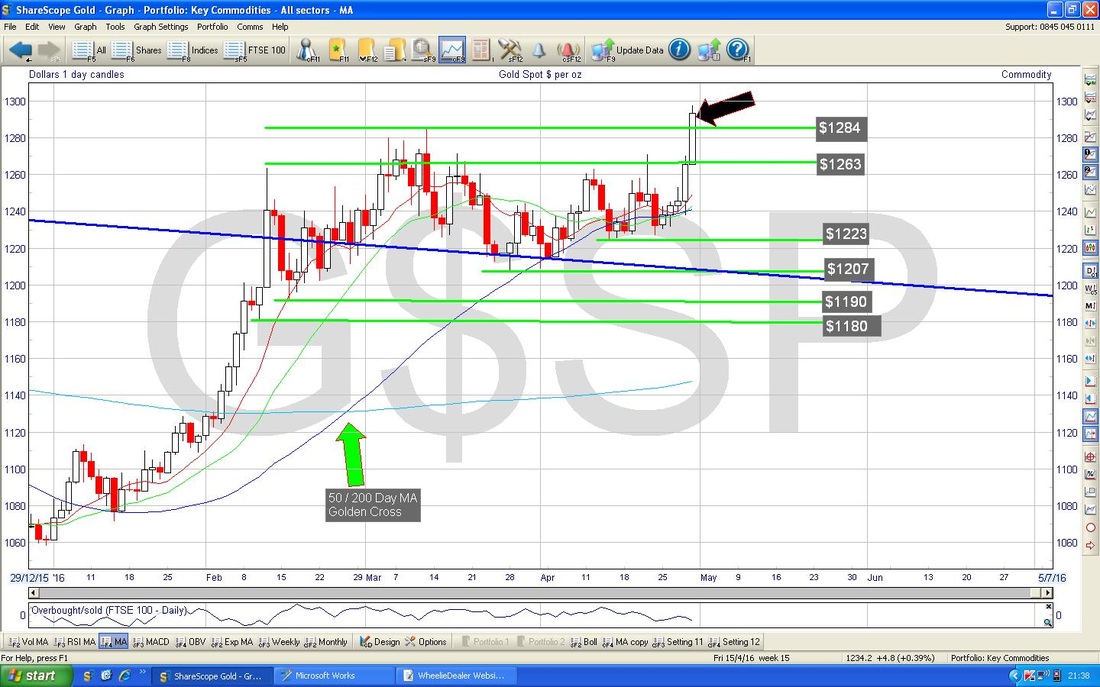
Below is the RSI Chart for Gold - it is currently reading about 64 - so it can go a lot higher before getting really ‘Overbought’ - Gold can easily push up to as high as 80 before turning down (most things tend to turn at 70 or a bit below).
Right, that’s it for tonight - I hope everyone has a profitable and stress free week, enjoy the Bank Holiday and get some time away from the Markets. See ya, WD. 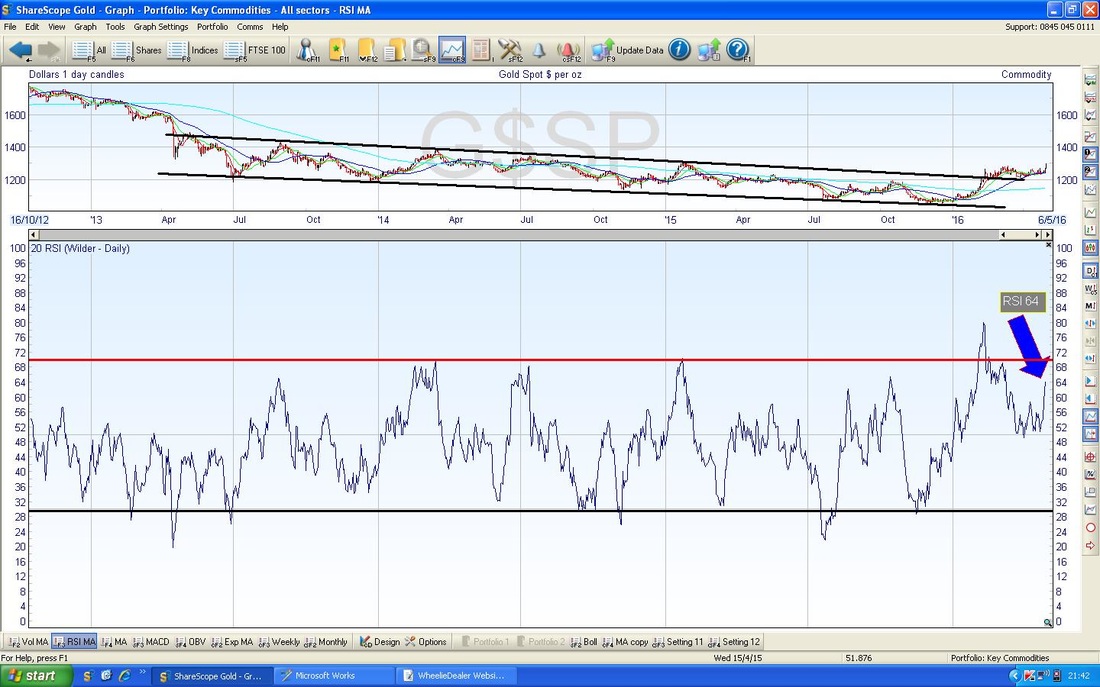
2 Comments
catflap
2/5/2016 08:09:39 pm
Good news on the Nikkei this week then. I read else where (was it the FT?) that this is a good leading indicator on the direction of the S&P. So im hoping for a quiet week.....
WheelieDealer
2/5/2016 08:56:41 pm
Hi catflap - yes, that's very good - if the Nikkei is shut then maybe it can't do too much damage !! Funnily enough I note it fell last night (monday) by 3%. Next time I look at the Indexes I will try to remember to revisit the Nikkei cos it is doing interesting things.........regards, WD Leave a Reply. |
'Educational' WheelieBlogsWelcome to my Educational Blog Page - I have another 'Stocks & Markets' Blog Page which you can access via a Button on the top of the Homepage. Archives
January 2021
Categories
All
Please see the Full Range of Book Ideas in Wheelie's Bookshop.
|
