

|
educational blogs |
|
Introduction
After a pretty momentous week where the FTSE100 officially went into a ‘Bear Market’, I was pretty keen to look at the charts and see how things were shaping up and where Support is likely to kick in and what would need to be done to get out of the Bear Market. It has always struck me that the definition of a Bear Market that is regularly bandied around of a ‘20% fall from the Peak’ is a bit silly and not all that helpful. My personal definition is a situation where Markets are so unhelpful that I find it very hard to make Money by going Long and it is far easier to make it on the Short side. Anyway, I was watching the BBC News or something reporting on the Market Drops this week and I saw a definition that was much more realistic - so I just looked with Google and came up with this:
“A market condition in which the prices of securities are falling, and widespread pessimism causes the negative sentiment to be self-sustaining. As investors anticipate losses in a bear market and selling continues, pessimism only grows. Although figures can vary, for many, a downturn of 20% or more in multiple broad market indexes, such as the Dow Jones Industrial Average (DJIA) or Standard & Poor's 500 Index (S&P 500), over at least a two-month period, is considered an entry into a bear market.”
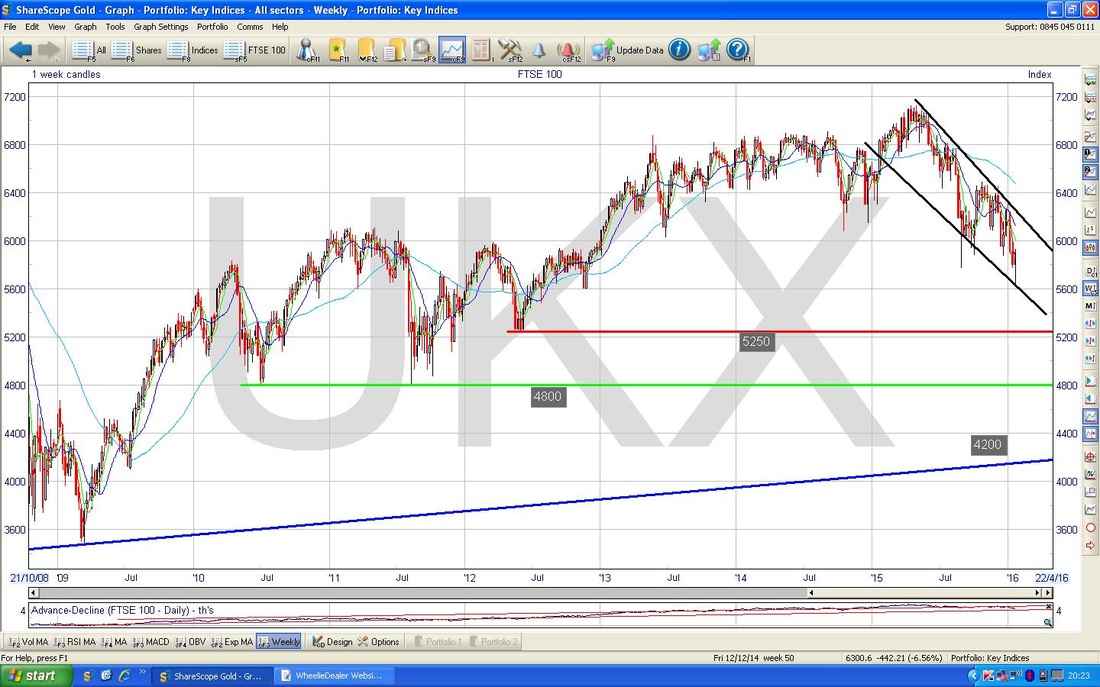
I got that from www.Investopedia.com and they also had this bit relating to Corrections: “A bear market should not be confused with a correction, which is a short-term trend that has a duration of less than two months. While corrections are often a great place for a value investor to find an entry point, bear markets rarely provide great entry points, as timing the bottom is very difficult to do. Fighting back can be extremely dangerous because it is quite difficult for an investor to make stellar gains during a bear market unless he or she is a short seller.” That second quote really lines up with my thinking about it being hard to make Money going Long (unless you are a Short Term In & Out merchant). Note also that there is no mention of the “10% Fall from the Peak” that is often used on the TV about a Correction and also it is worth thinking about how this quote clearly flags that ‘Catching a Falling Knife’ is a bad idea. Strategy I have now gone into Lockdown mode - I have about 45% of my Long Exposure hedged via FTSE100 Short Spreadbets and with a XUKS ETF in my ISA and if we get a bit more upside in coming weeks (which I think is likely) then I will be looking to sell more Stocks. I will most likely be topslicing Positions rather than selling outright - I am happy with my Stocks but would just like less Long Exposure. I can see the coming months being pretty relaxing for me - in these kind of Conditions I have no interest in Buying stuff and would far rather let it play out until we are clearly in a Bull Market again - I cannot see the point of fighting the tide. The Brexit Vote is likely to be late Summer or early Autumn and I think this will cast a negative cloud over our Market going through much of 2016 - Summers are usually rubbish and I think the Brexit Vote could ensure that this year it excels at its rubbishness. I am happy to let my Hedges run and might add a little bit more if we rise enough and get a clear Reversal Signal to suggest we are going down again - I might add another 10% or so. I would particularly like it if I can shift some Stock in my ISA and that would give me the Cash Firepower to buy a reasonable chunk of XUKS so I can hedge more within my ISA Account. It is pretty clear that 2016 is going to be a tough year. I am very much in ‘Capital Preservation’ mode and my expectation is that I do not expect to make much if any gains this year. It is really a case of minimising Losses for the year and making sure I am well placed for when the next Bull Market starts - if your Capital gets destroyed now then you are unable to get in for the start of the Bull Market. These early stages of a Bull Market are some of the most lucrative times in this Investing Game - it is vital to be able to take full advantage as it will be pretty easy to make maybe 30% in a year during these early Stages. FTSE100 The Screenshot below from my wondrous ShareScope software shows a Long Term view of the FTSE100 - going back to about 1994. The Blue Line at the bottom marks a Long Term Uptrend and this will have a lot of dominance if the Market gets really ropey - this suggests that there is very strong Support at 4200. I doubt we are going that low but of course we can never predict the future and such a move is possible. I have also marked Support Levels at the Green Line 4800 and the Red Line 5250. My hunch is that we will certainly visit 5250 this year and 4800 would not be a huge shock. 
On the Chart below I have zoomed in to the Bull Market since 2009 so that the Support Levels etc. are clearer to see. The Black Lines are showing a Downtrend Channel that has formed since last April.
The Chart below zooms in again to a bit under a year. The first thing to notice is my Red Arrow which points to the Red Downtrend Line and this is the critical element of this Chart. This Downtrend is capping everything and we can forget about any kind of change from a Bear Market until that line is broken - even if that happens, we might only be into a Sideways Range but it would nonetheless show that the Bear Market is ending. My Red Arrow points to about 6200 and this is a level that must be got over to give Bulls any hope. If 6200 is cracked then 6300 and 6450 are Resistance Levels that must be broken. A Breakout from 6500 would be telling us that a Bull Market is back on.
The Critical Failure of Support this week at the ‘Black China Monday’ (August 24th 2015) Intraday Low of 5768 at my Green Horizontal Line was a very bearish development and it has created a new Low at 5639 which is now a Vital Support Level that must be held. If 5639 fails then the likelihood of us visiting the 5200 Level and lower is very much increased. From this new Low we put in 2 decent White Up Candles but we now face Resistance around 6000 and 6100. The Market closed at 5900 from Friday and it is vital that it builds on this now - failure to rise now will be a Confirmation of the Red Line at 5900 which was previous Support now becoming Resistance and will cap any gains for a while. Technically this is very likely. Another important factor is the Simple Moving Averages. My Green Arrow points to the Feint Blue Line which is the 200 Day MA and my Black Arrow points to the Darker Blue more wavy Line which is the 50 Day MA. Note both these Moving Averages are falling and this is a bad sign. In fact, the 200 Day MA falling denotes a Downtrend. If you look back to around late July you will see where the 50 Day MA passed down through the 200 Day MA and did a ‘Death Cross’ - subsequent Price Action has confirmed this Bearish signal. Note my Black Arrow shows the 50 Day MA at about 6100 - this will act as Resistance to the Price. It is also worth noting that the Red Lines which form a Triangle I mentioned in a previous Blog were broken to the Downside last week and it would be unusual for the Price to move back within the Triangle after such a Breakout - this is something to watch closely in the next few days. 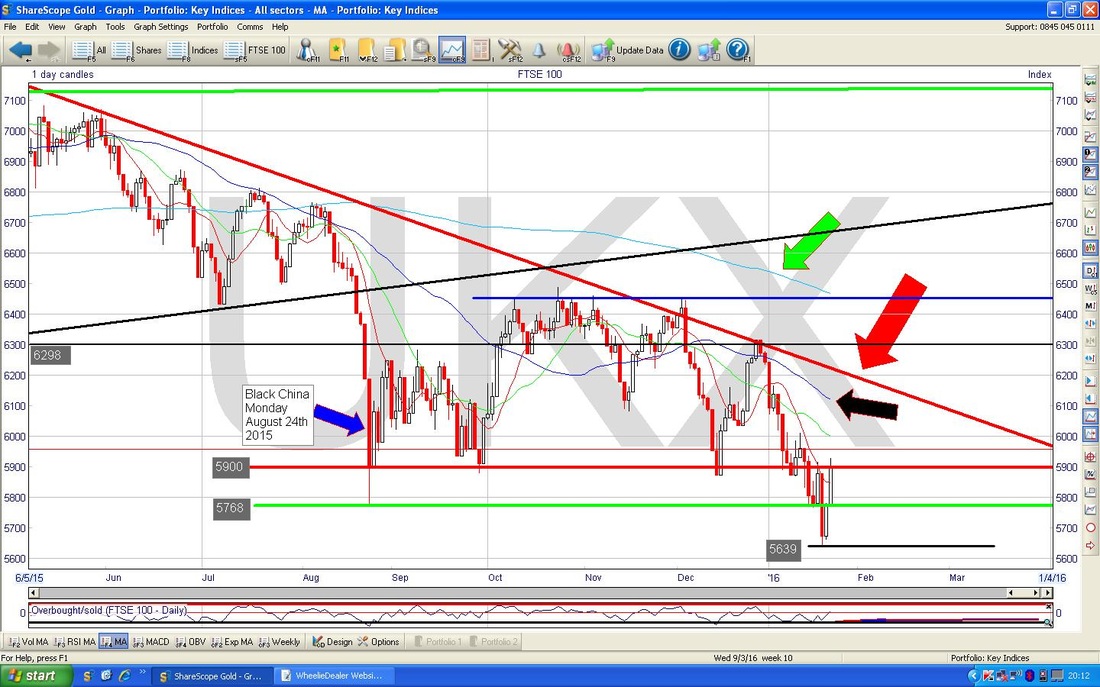
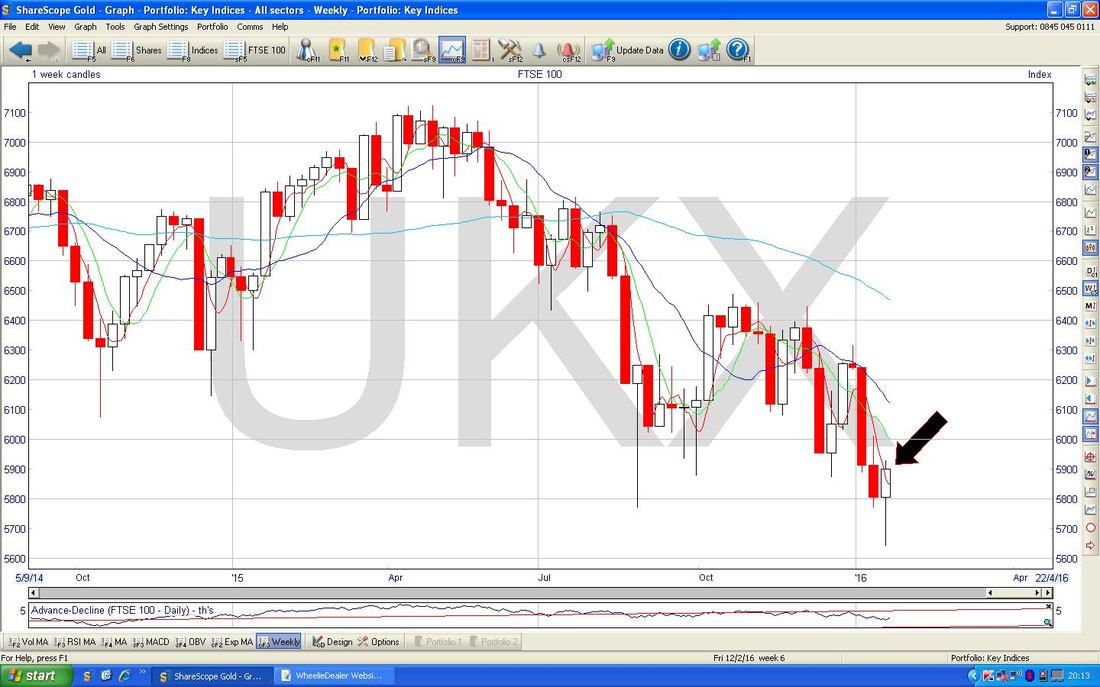
The Chart below has the Weekly Candles - my Black Arrow points to a rather nice Hammer Candle which is Bullish after the previous 2 Red Down Candles.
The Screenshot below has the Relative Strength Index (RSI) in the bottom Window. My Blue Arrow points to the current level or about RSI 45 and this does look to have turned up. We need it to get over 50 for things to be more positive but it looks good for coming days.

In the top Window on the Screen below, we have the Bollinger Bands. My Green Arrow shows how the Price has moved up off the Bottom Bollie Band - this is positive.
The bottom Window has the MACD (Moving Average Convergence Divergence) and my Blue Arrow shows how the Histogram ‘Humps’ look like they are about to go from Red to Green and the Black Arrow shows a similar thing on the Lines (these are just 2 ways of representing the MACD) - so we should get a Bullish Crossover soon. 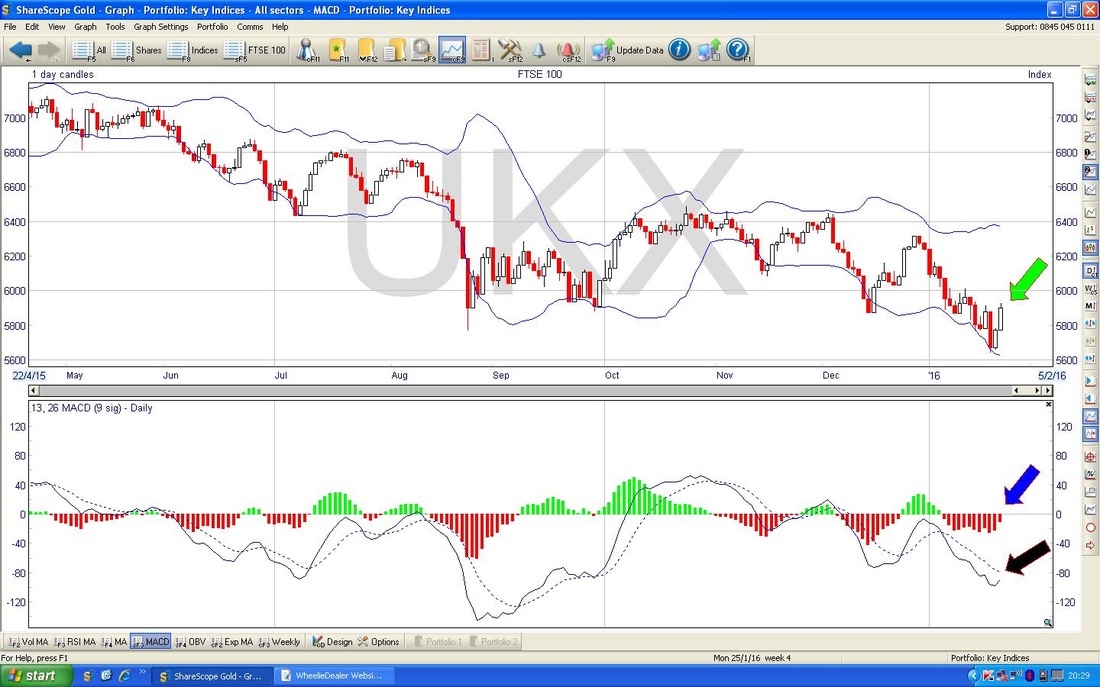
S&P500
My Chart below is a Long Term view on the S&P500 going back to 2009 and shows the lovely Bull Market Uptrend Channel but it is clear how the bottom Black Line was breached recently - which is negative. 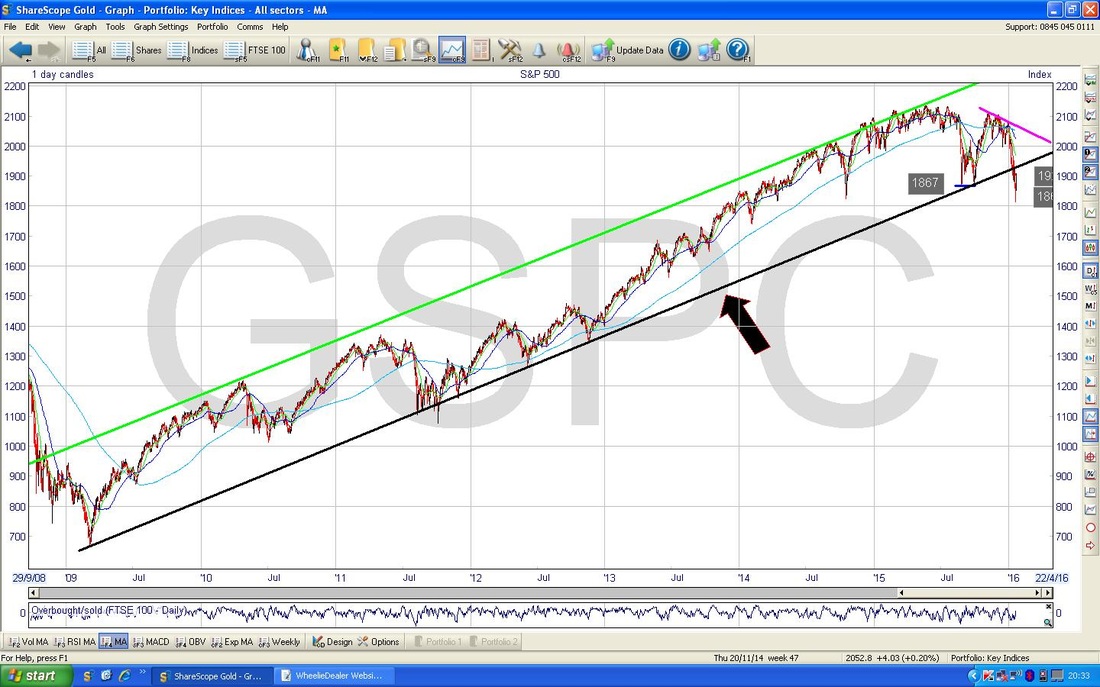
The Chart below zooms in to just under a year. I have marked the New Intraday Low that was put in last week at 1812 (that’s some Overture) and it is vital that this Support now holds.
The Price is now moving Up with a decent White Up Candle from Friday but it faces Resistance at the bottom of the Black Uptrend Line and my Black Arrow points to where this Resistance kicks in at about 1930. My Green Arrow points to Horizontal Resistance at 1950 which will probably be quite tough to get through. My Red Arrow points to where the 50 Day MA and 200 Day MA have done a ‘Death Cross’ - oh dear….. 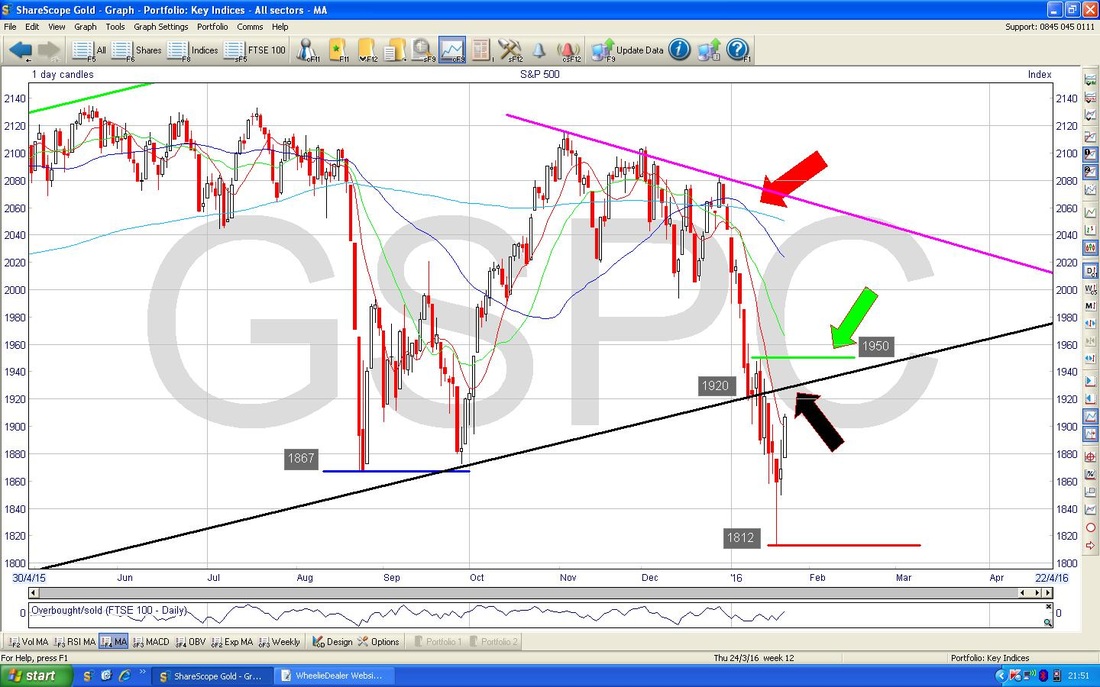
The Screen below has the Bollie Bands in the top Window and you can see where my Black Arrow is that the Price has moved up off the Bottom Band - this is good for Bulls.

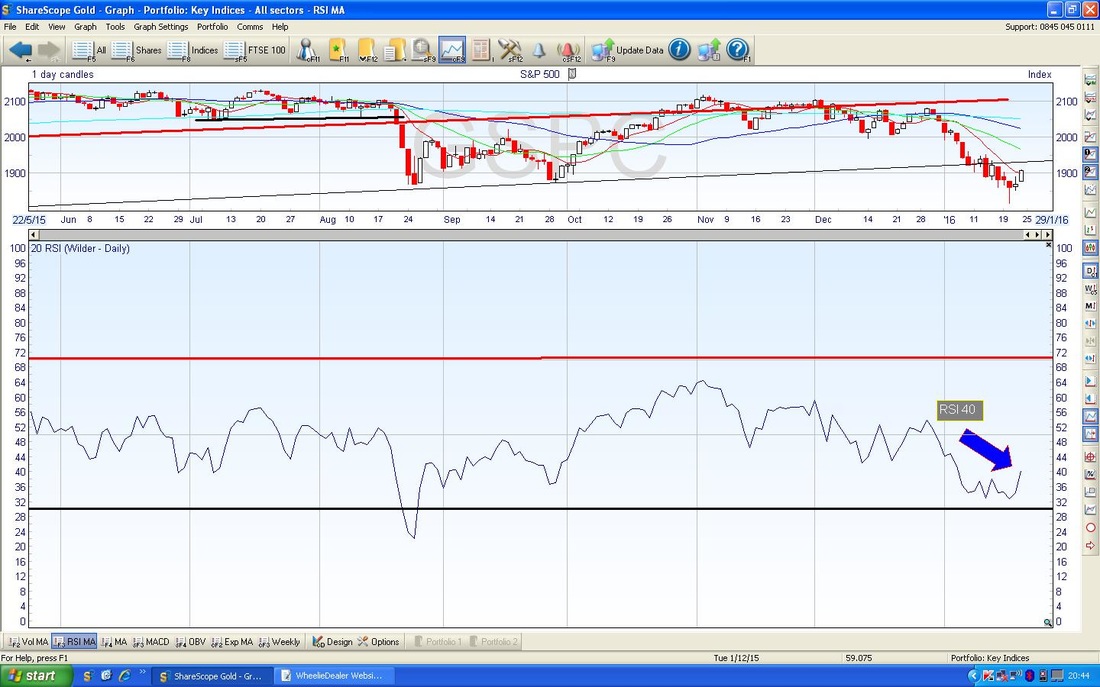
In the bottom Window below you can see the RSI for the S&P500. My Blue Arrow points to where the RSI finished from Friday at 40 and it looks like moving up.
As with the FTSE100, the S&P500 did a nice Hammer Candle on the Weekly as shown below with my Black Arrow.

Brent Oil
Obviously Oil has a big impact on the FSTE100 so it is worth seeing how the Charts look on that. The Chart below shows around 9 months and the first thing to spot here is the Red Downtrend Line denoted by my Red Arrow. This Line is very Strong Resistance to the Price and Bulls need to see the Price over about $38 to suggest it is breaking out. The Feint Blue 200 day MA Line at around $50 will be strong Resistance as well. My Black Arrow shows the previous Support Line at $35 which will now become Resistance - bulls need the Price over this level first if we are to make upside progress. 
The Chart below zooms in a bit and my Blue Circle shows an Area of Resistance at about $38, this will be a tough area to get over. It should also be clear to see Resistance which is kicking in now at $32 (Blue Horizontal Line) and Support at $27 (Green Horizontal Line) - this Support must hold to avoid a scenario where we head towards $20. It is still too early to say the bottom is in - I would only start thinking this way if we go back down to $27 again and if it holds as Support and forms a ‘Double Bottom’ - this would hint a Floor is being built.
Right, that’s enough pics for one Night, as you can see we are in a pretty significant time for the Indexes and what happens in the next couple of weeks will tell us a lot. Hope you all have a stress free and lucrative week, WD. 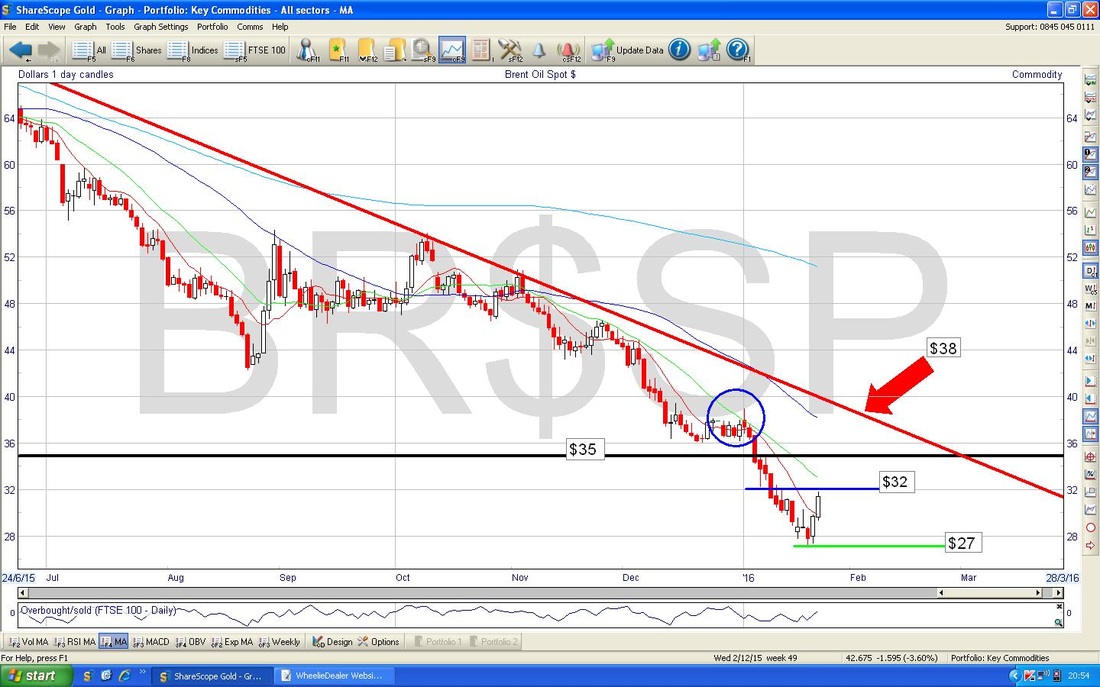
4 Comments
catflap
25/1/2016 01:53:47 pm
Thanks for this blog post. Finding it difficult to read the markets at the moment given the volatility.
WheelieDealer
25/1/2016 11:38:00 pm
Hi catflap, glad you liked it - as you say the Markets are well choppy at the moment with some crazy intraday moves. I can't help thinking more weakness is most likely and I am happy to have a pretty chunky Short in place now. Interesting times..........WD
Jonh
25/1/2016 08:55:42 pm
Thanks for charts, analysis and how you are reacting. Very interesting seeing this all happen in real time. Have bought XUKS representing small proportion of portfolio. Will see how it goes before committing more. Big decisions as this is real money invested for pension.
WheelieDealer
25/1/2016 11:41:00 pm
Hi Jon, Great to hear you like the info. It has always been a theme of WD that you can find Tips and suchlike everywhere but very little useful stuff on how to manage a Portfolio day in day out for the duration. Wise move to buy XUKS in a small way and to see how it goes - good to experiment before going big. You will be pleased to hear a specific Blog on Hedging will be released very soon, WD Leave a Reply. |
'Educational' WheelieBlogsWelcome to my Educational Blog Page - I have another 'Stocks & Markets' Blog Page which you can access via a Button on the top of the Homepage. Archives
January 2021
Categories
All
Please see the Full Range of Book Ideas in Wheelie's Bookshop.
|
