

|
educational blogs |
|
I am meeting up with a small group of Investing mates tomorrow in the PUB and won’t have any time to look at the Charts, so it’s Saturday Night Chart Fever again. It sort of feels a bit eerie at the moment - Autumn is nearly always a difficult time for Markets and September particularly so, and there is a real sense of Lull before the Storm. I guess if we are Bullish and optimistic then the Storm might be a huge rise in Share Prices - but after the strong rises since the Brexit Vote and with Donnie Trumpo about to become the Pres, it seems a huge stretch to really think a Rally is on the cards.
Another cloud kicking around (as it there weren’t enough already to fill the Skies of most of the Planets in our Solar System), is a fear that when the UK Government can finally be bothered to trigger Article 50 (or if you are a Bake-off Viewer it’s “Arctic-Roll 50 before Breadxit”) this will provoke a Sell-off in Stocks. Personally I am not convinced - surely the Markets are fully aware that “Brexit means Brexit” and I can’t see the admin exercise of lodging the Paperwork really that big a deal. I would have thought that the Markets already think Brexit will happen - is it really the case that they think the Vote will be overturned or something? I just can’t see it, that seems like wishful thinking by people who want to stay in the EU.
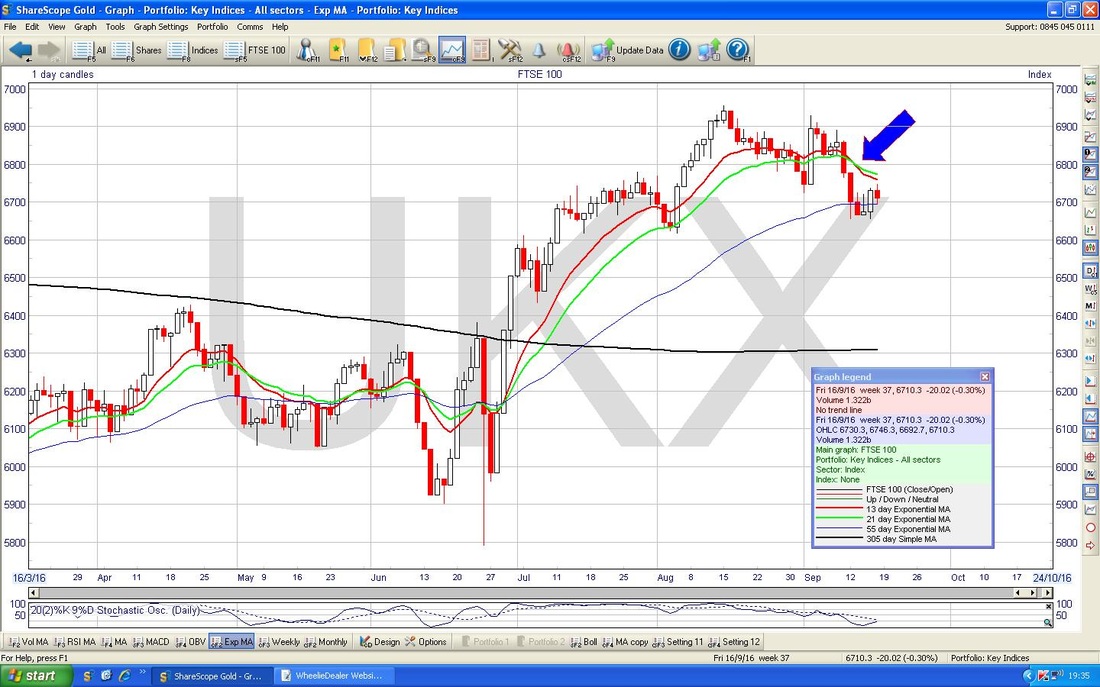
On that subject, it has become apparent to me that there is no sense leaving the EU and staying in the Single Market. A big reason I voted to escape the EU silliness was because I strongly believe that much of our current Economic sogginess comes from over-regulation - and if we stay in the Single Market, then the Rules of that regime will apply to ALL UK businesses - not just the ones that Export to the EU. Personally I think that is daft and if we stay in the Single Market we might as well stay in the EU. Anyway, there was some chatter on the News today about Article 50 being triggered in Jan/Feb next year - so it is still a potential ‘problem’ for the Markets that is some months away. Before that we have Trumpy vs. Billary and I suspect that will have much more impact. Trump has some pretty whacky Economic Policies (a cross between Jezza Corbyn and Ronnie Raygun) and although there is merit in much of what he says, I suspect that moving to such an Economic Model would be very difficult in practice and cause a lot of turmoil - it is likely that Wall Street will not like this. The challenge is that many of The Donald’s Policies will have massive appeal for Voters and they will soon forget his Racist and Nutty image if they think they will get Tax Cuts of 30% - “It’s the Economy, Stupid”……. Anyway, enough of that, let’s consult the UK Stockmarket Almanac 2016.… Historical Backdrop Just to hammer the point home, September is THE WEAKEST month on average and in a typical September the FTSE100 has 4 Down Weeks - so far we have had 2 - will we get another 2 before some respite? The coming Week (Week Commencing 19th September 2016) is on average Up for 39% of years and the average Return is MINUS 0.5% - so it tends to be soggy. In fact, it is the worst Week of September on average. We have the US Federal Reserve meeting this week but I can’t see much happening on Interest Rates and I would think the Markets have priced things this way - if anything it might be a surprise to the Upside - Markets would not like this. Now the Charts…….. FTSE100 I had a strange week on my Portfolio last week - despite my huge Shorts on the FTSE100, I was actually down around 0.9% and this surprises me really. The Nasdaq did well but I do not have all that big a Short on this one - anyway, as a result of my puzzlement I wanted to look at the Weekly Chart first - so here it is. Standing back (difficult for me, if you don’t mind I will sit back), it is possible that we have dropped back in the last couple of Weeks from the Upper Line of the Blue Uptrend Channel - if this is the case, then we might see quite a lot more downside - perhaps down to even 6100 - 6200 which is where the bottom Line of the Uptrend Channel is. This sounds very extreme but I guess if we do get a panicky Sell-off (and these things are far more common than most of us would want to believe - in fact, someone on Twitter the other day suggested to me that they happen around every 6 months), then maybe it is possible. God help us if that happens but at least it will help me unwind my irritating Shorts Problem !! My Yellow Circle is highlighting the Candle what was produced last week. This is a bit of a Hammer (which could be seen as positive) but it’s not really ‘Textbook’ because it has a very thick ‘Body’ and only a short ‘Tail’ and the context is not great because Hammers work with much higher reliability as a Bullish Signal after a sustained down move. On the basis of these caveats, I suspect this Hammer is not a Bullish Signal and we will most likely see more Down Weeks. If I am right and we do fall more, then I would think a target to the downside would be to find Support at around 6400 to 6500. As I mentioned earlier, a drop to 6100 - 6200 might be possible but I don’t think that will happen unless the Trumpy Wig really hit’s the Fan !! (or Billary hit’s the tarmac……) I note the 200 Day Moving Average (the feint blue Wiggly) is at about 6300 - this often acts as Support in a big Selloff and that’s another Support Level to be aware of. On the upside, if we can get a Rally going, the obvious Resistance is at 6800, 6900 and 6955 - and if we crack these, there is still a lot of Resistance from the All Time High at 7122. A Breakout above 7122 would be marvellous but I just can’t see it happening anytime soon - at best maybe it is a trick the Markets can pull off in December/January - but with the Fundamental Backdrop (not to mention stretched Valuations) I find it hard to believe. 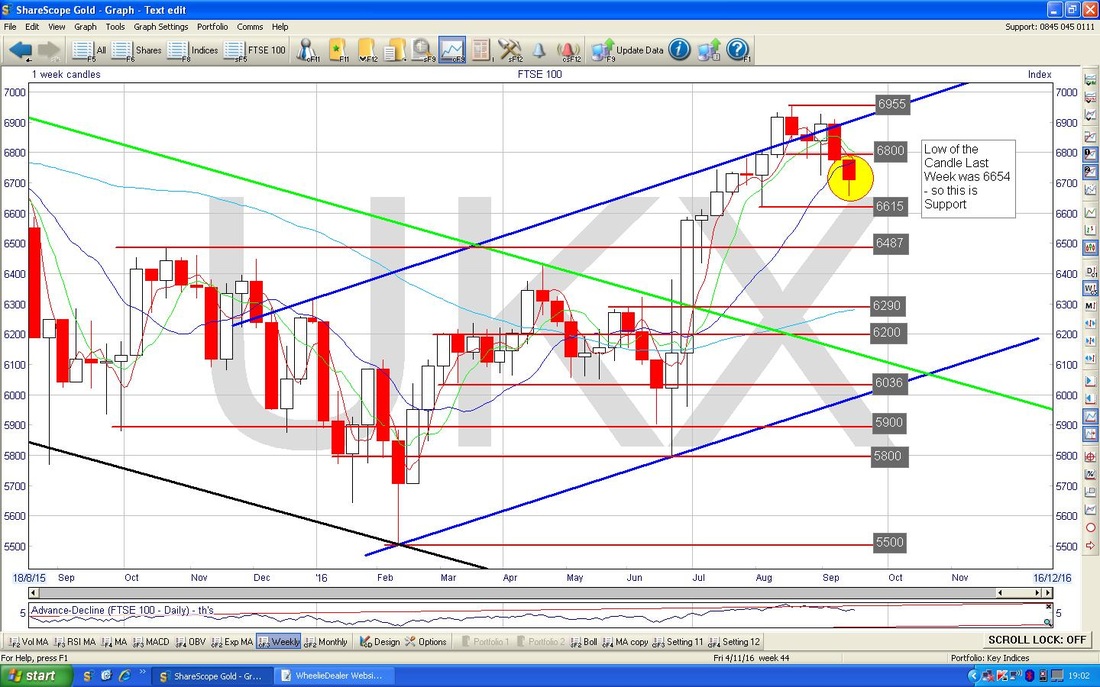
Right, let’s go more granular and look at the Daily (I won’t do the Big Picture this week - if you want to see that go back to last week’s update - that hasn’t changed much). My Black Arrow on the Chart below is pointing to a ‘Cotton Reel Doji’ that was bashed out on Friday - after the strong move up on Thursday, this suggests the strength of the move has already started to wane - although with all these potential Reversal type Candles, they really work better as predictors when there has been a sustained move in a particular direction - just 1 or 2 days is not a great basis for prediction. The key thing here is that the High of the Day on Friday was 6746 - this level needs to be broken through next week.
Down below there is a lot of Support at around 6650 - if this gives way, then we will be relying on 6616 to hold - if that fails as Support, then it looks pretty troublesome. Note my Red Line marked with the Red Arrow - this could put a brake on any attempts to Rally. Note also we are under the Darker Blue wavy 50 Day Moving Average line - this is at about 6760 and again could act as Resistance. 
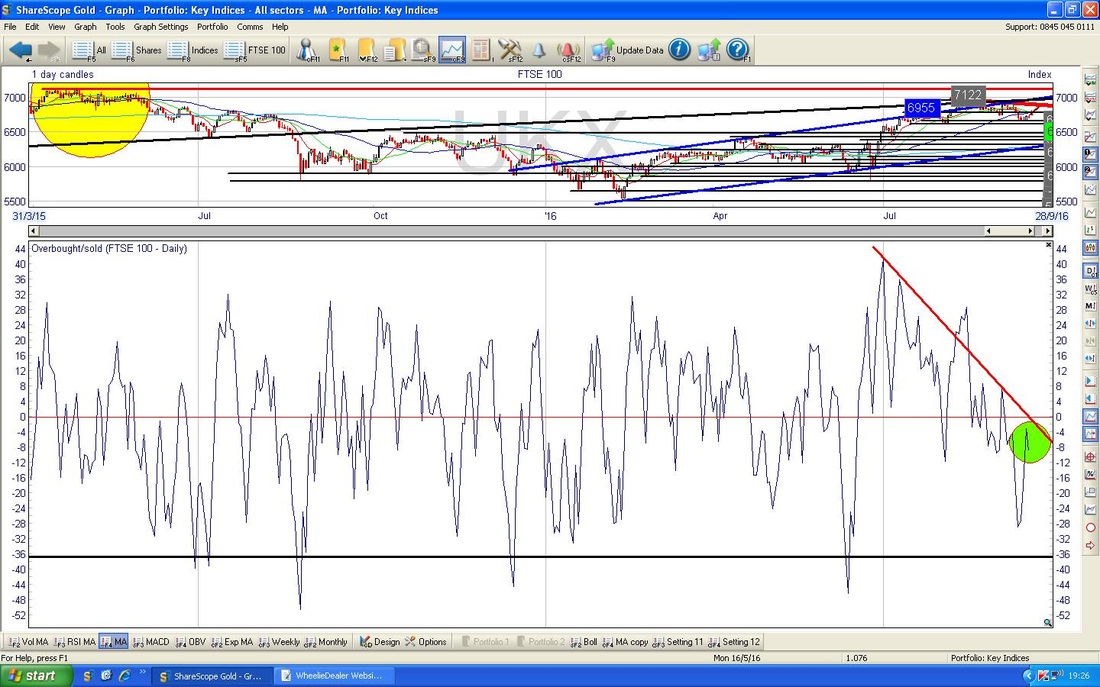
On the ScreenShot below, from the marvellous ShareScope Software that I use, in the Bottom Window we have the Overbought/Oversold Oscillator thing for the FTSE100 Daily. My Green Arrow is pointing out how it rose up to near the ‘Neutral’ 0 reading but has now flicked down after the weakness on Friday - this might be a worry. Note, the OB/OS is a very short term indicator.
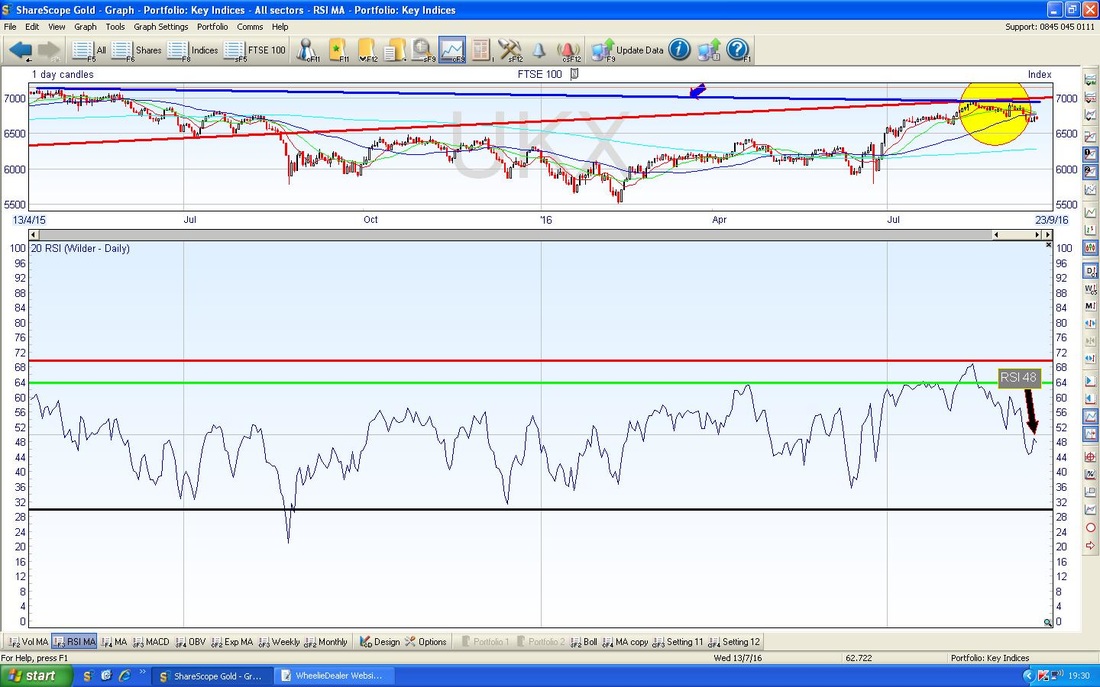
In the bottom window below we have the Relative Strength Index (RSI) for the FTSE100 Daily. In a similar way to the OB/OS, this has flicked down after Friday and just below the Neutral 50 level - this might be a problem. A Bullish Chart has the RSI in the Upper Half above 50, if this stays below the Neutral level, then it shows weakness.
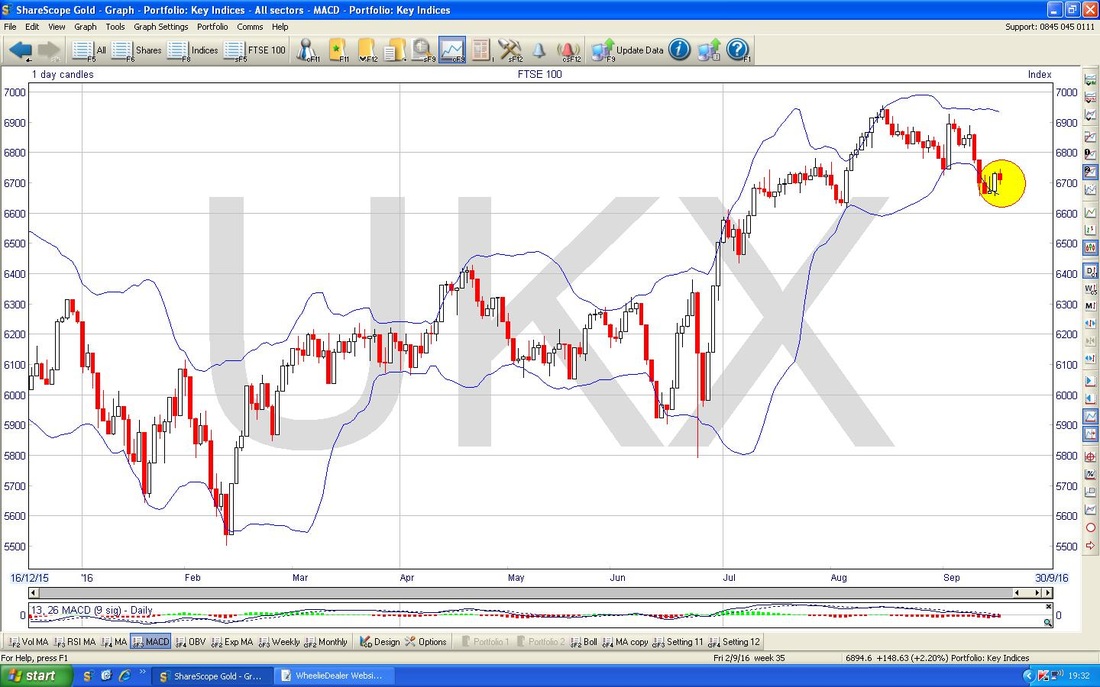
The Chart below has the Daily Candles with the Bollinger Bands above and below them. My Yellow Circle shows how the Price moved up last week off the Bottom Band - this is a positive thing but obviously it needs to be sustained. Note the Upper Band is around 6950 - if we can rally, this would be a Resistance Level.
The Chart below is important. My Black Arrow is showing where we had a 13 / 21 Day EMA (Exponential Moving Average) ‘Death Cross’ (the Red Line is the 13 Day and the Green Line is the 21 Day). Until this shows signs of unwinding and we start to setup a Bullish ‘Golden Cross’ between these, the FTSE100 will stay bearish.
DAX (German)
There are some interesting things going on here - it is worth watching because if the DAX drops the chances are that the FTSE100 etc. will drop with it - Global Markets are remarkably closely correlated. The Chart below has the Weekly Candles for the DAX. My Yellow Circle (recycled from a previous Blog - the wonders of dragging with a mouse - very Green I am) is highlighting an Inverted Hammer Candle that was created last week. OK, it’s not a beauty and really I think this is just in essence a good old fashioned Down Candle which is bad news. If it had been a ‘prettier’ Inverted Hammer with a longer Handle and a thinner Hammer Bit and the context had been after a sustained move down, then I might think this is a Reversal Signal and we could rally. In this context, it looks pretty ropey. Note how the Week closed out pretty much at my Blue Downtrend Line which the DAX had broken-out of a few Weeks ago - it looks very like it could fall back within this line again. Note Support at 10092. 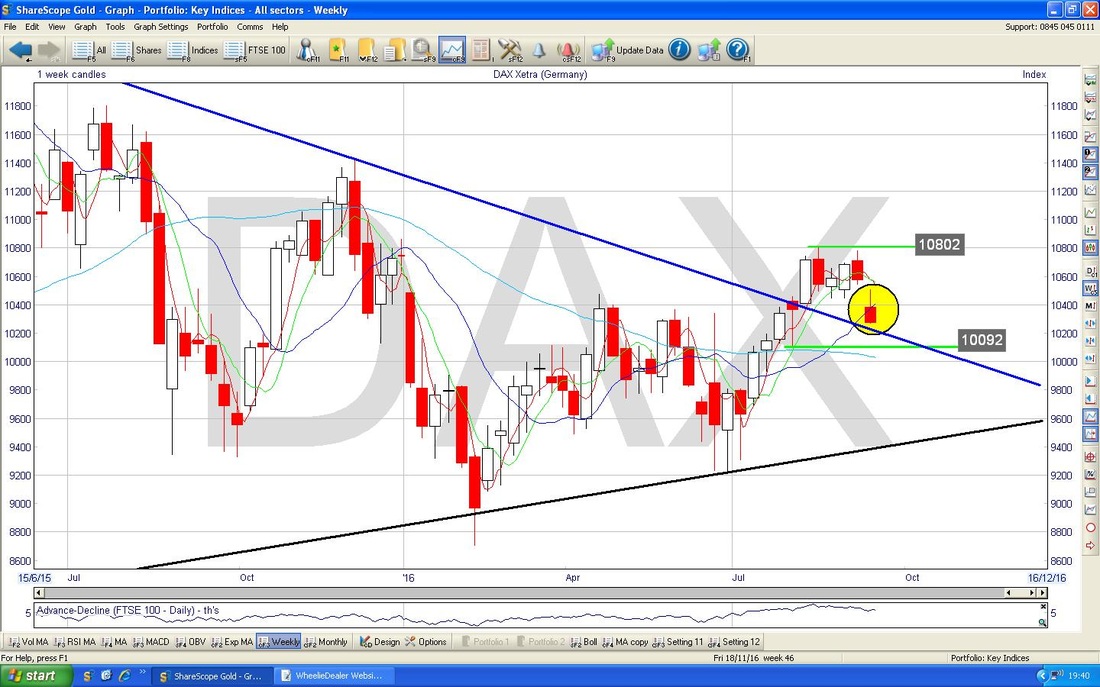
Right, now let’s go for the jugular, sorry, the granular……
The Chart below has the Daily Candles for the DAX - the key and worrying thing here is that my Black Arrow is pointing to a dirty Red Down Candle from Friday and note that it broke below the 10299 Level which was Support from the Hammer that I have rudely pointed at with my Green Arrow. This is very poor Price Action. Note my Yellow Circle which shows the Inverted Hammer from a while back that is still casting a nasty shadow over this Index and 10800 is the Key Resistance Level that Bulls need to get over. Note also how this is a beautiful (some might say “Textbook”……..) example of an Inverted Hammer and its predictive powers (Mystic Meg) after a strong rise up. 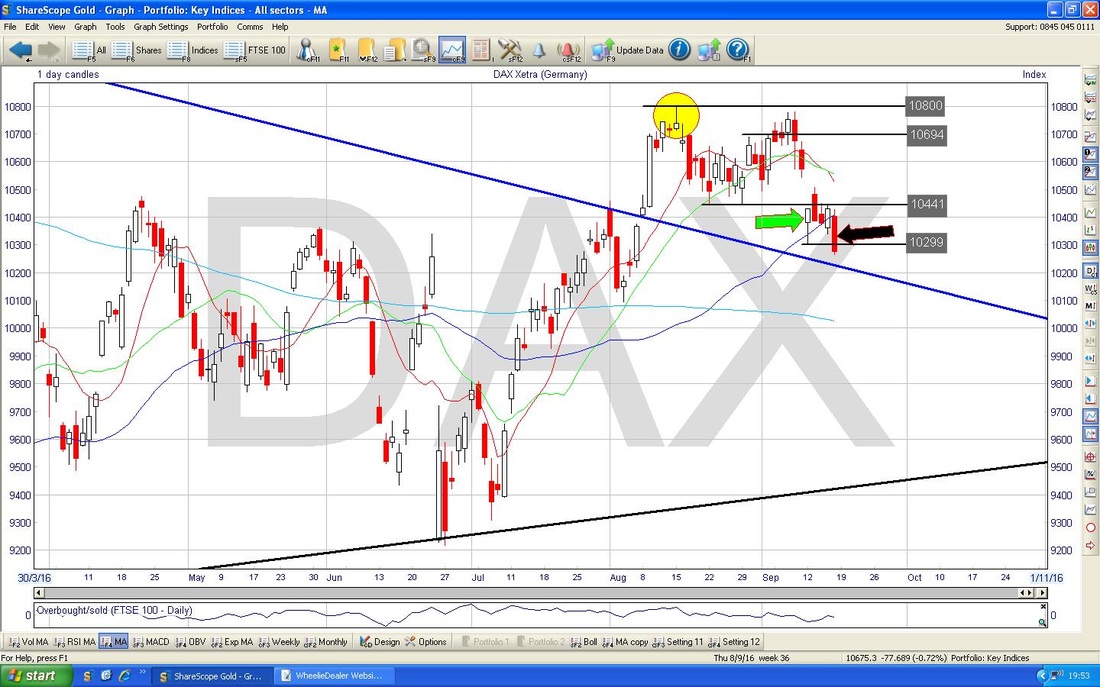
S&P500 (Main US Index)
Below we have the Weekly Candles for the S&P. My Black Arrow is pointing to what I suppose is an Inverted Hammer but not a pretty one. It’s a weird Candle really - I don’t think we can call it a Reversal Signal because the move down prior to it has only really been 1 week and if anything the Candle from last week hints at weakness because even though it did rise on the week, it fell away from the Intra-Week High at 2163. There is Support from last week at 2120 - this is important to hold - if it fails, there is Support below at around 2080 then the 200 Day Moving Average (feint Blue wiggly line) at about 2050. 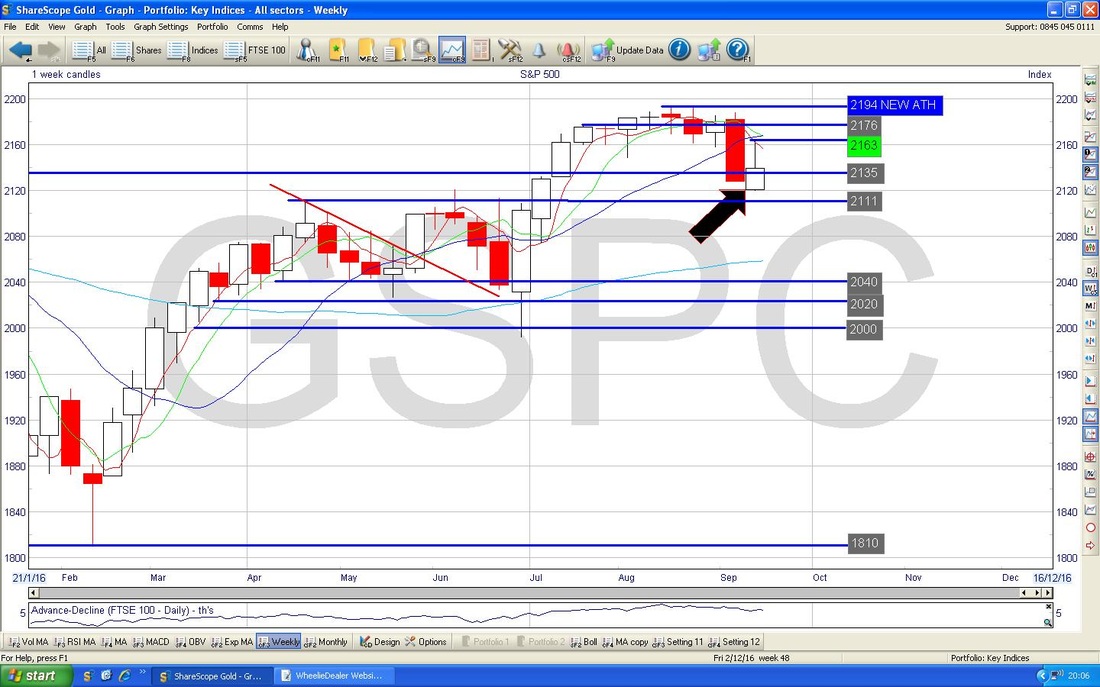
Drilling in to the Daily Candles, the Chart below is rather busy but I am short of time to tweak it. Anyway, my Yellow Circle is highlighting the Big White Up Candle from Thursday and the small Red Down Candle on Friday which has a ‘Tail’ pointing down. Together these form what could be a ‘Bearish Harami’ 2-Stick Candle Pattern (if you have the ‘Candles for Dummies’ book then it is page 159) or maybe a ‘Bearish Piercing Line’ or ‘Dark Cloud Cover’ (Page 173 of Dummies) - whatever you want to call it, I don’t think it’s at all Bullish.

Nasdaq 100 (US Tech)
This Index has particular interest for me as I am short the swine. Sadly for me, on the Weekly it has done a Big Bullish Engulfing Candle (marked with my Black Arrow) and this suggests a rise to come. However, it needs to crack the All Time High (ATH) at 4838 and I think this jump up was caused by Apple AAPL doing well last week (AAPL has a huge Weighting in the Nasdaq Indexes). 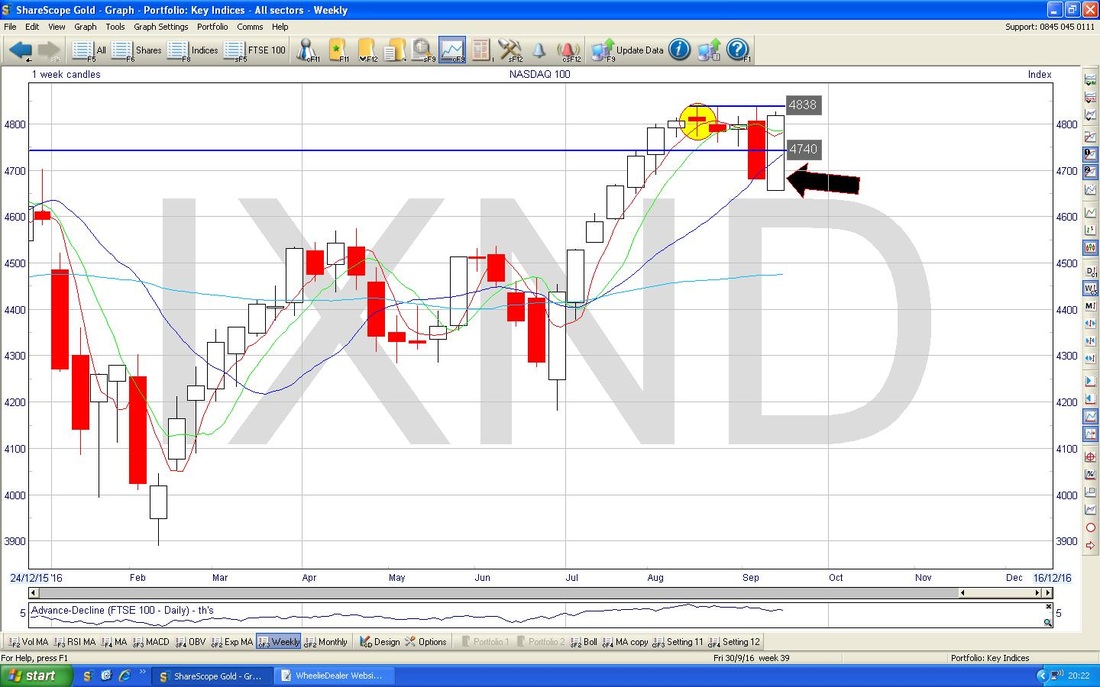
Apple AAPL
Following my comments on the Nasdaq 100, I thought it would be useful to check out the AAPL Chart. My Chart below has the Daily Candles for AAPL. My Green Circle is highlighting an almost Textbook ‘Bearish Harami Cross’ 2-stick pattern (Page 162 of Dummies) - this suggests that AAPL will drop back next week and this seems very likely in the context of the move up. This gives me some hope that my Nasdaq 100 Short might not feel too much pain in the coming week. However, on the Bulls side for AAPL, my Blue Arrow points to a Golden Cross a couple of weeks back between the 50 and 200 Day Moving Averages - I suspect part of the recent move up was a Technical thing as Buyers saw the Golden Cross. 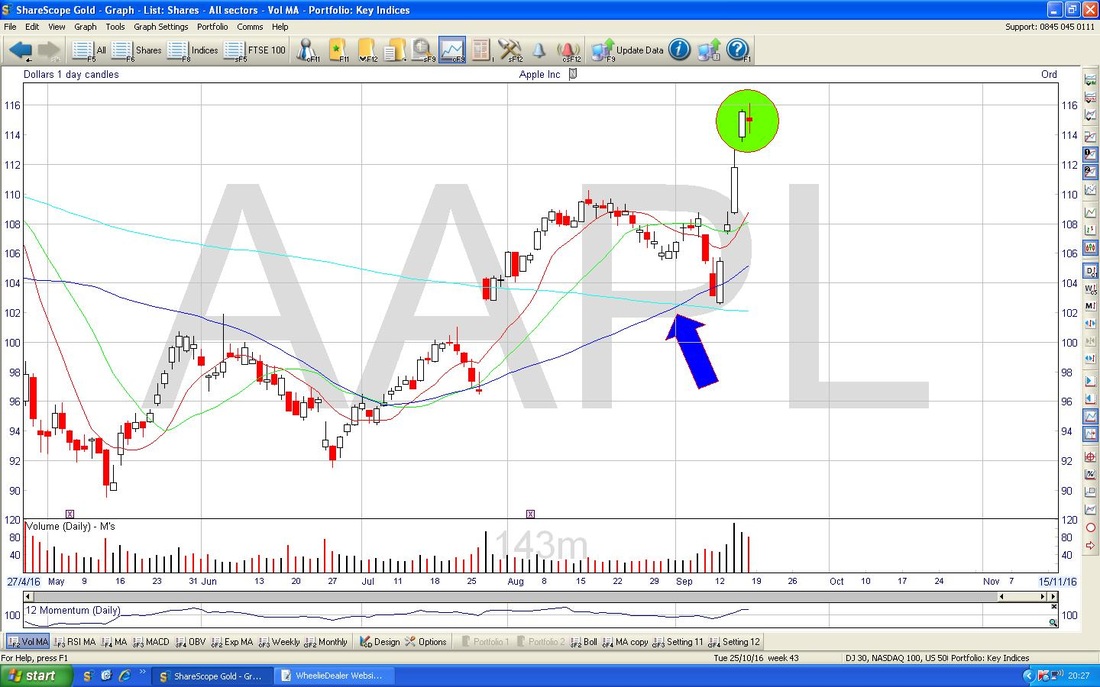
Brent Oil (Spot)
Obviously Oil has a big impact on the FTSE100 so this has particular interest for me - not just because of my Shorts but also because I hold a slug of Shell RDSB. The first Chart is the Weekly Candles. Note my Blue Downtrend Line marked with the Blue Arrow - this is proving difficult for the Price to get over. My Black Arrow is pointing to a bit of a ‘Cotton Reel’ Doji which was created last week - note it has a pretty wide body and ‘Wicks’ or ‘Tails’ at the top and bottom of about the same size. Anyway, the key thing here is that it made a new low compared to the prior week. 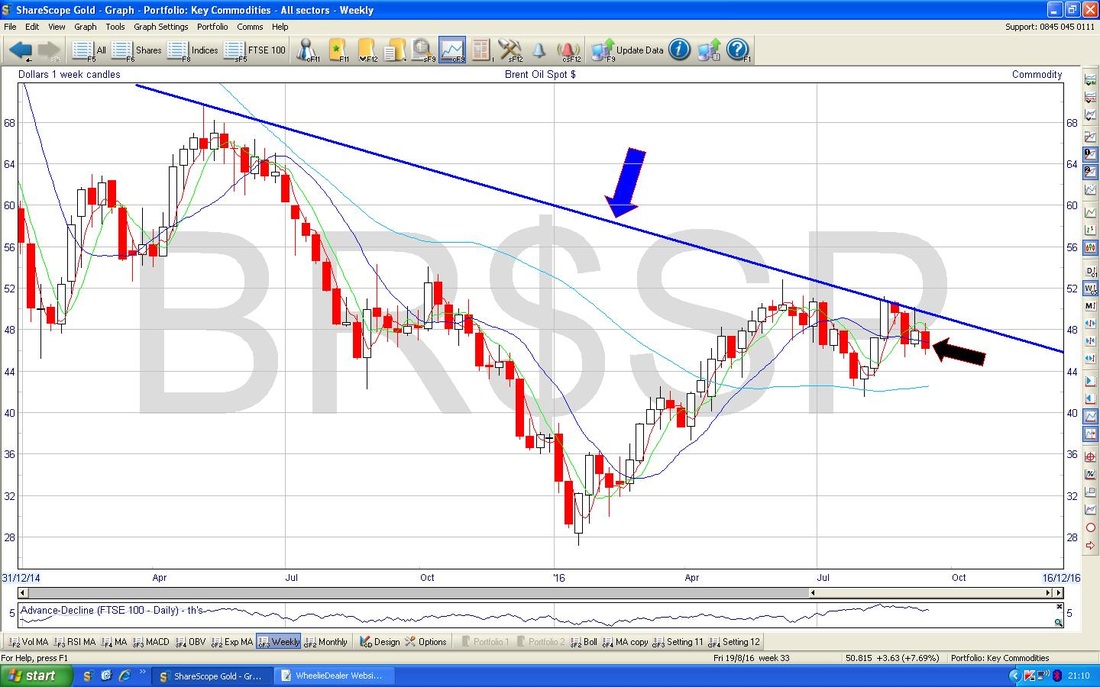
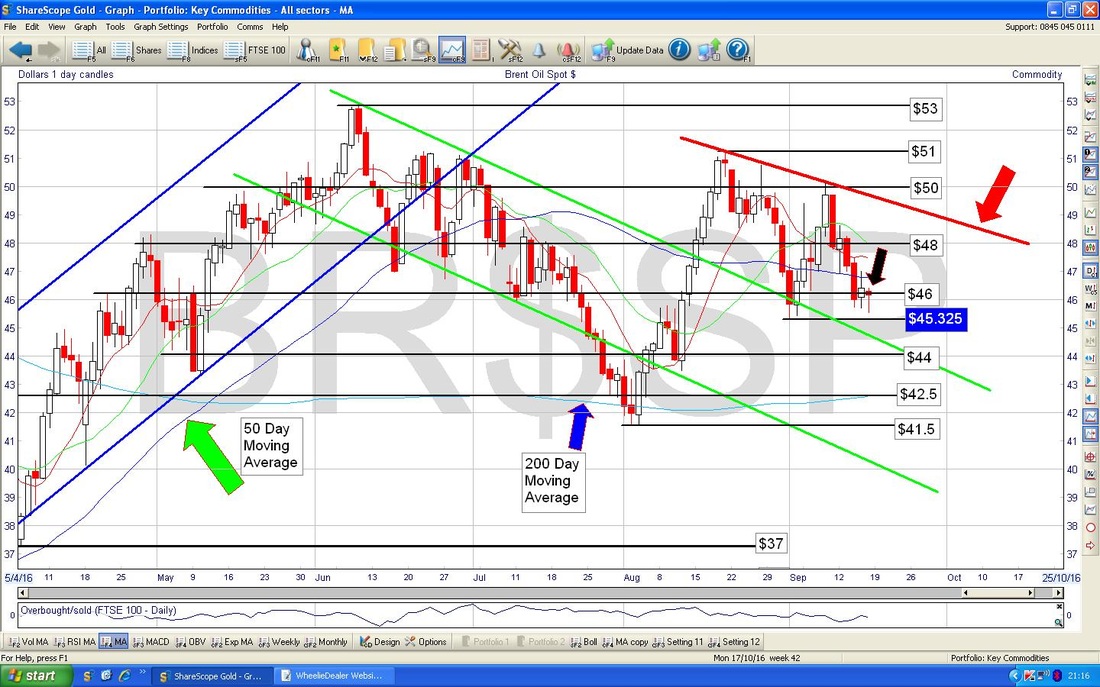
The Chart below zooms in on the Daily Candles. My Small Black Arrow is pointing to a Hammer Candle that was generated on Friday - I reckon this might prefigure a move up in the very short term but there is a lot of Resistance up above at $47 and $48 to $49 ish. That Red Line marked by my Red Arrow could hold things back. Underneath, the Blue Text Box with $45.325 in it is critical Support - if this fails, then we might see a push down to $43. With the overall Bearish tone around everything, I suspect we might see a push up for a couple of days and then turn down again.
Gold (Spot)
I won’t go granular on this one - below is the Weekly Candles for Gold (Spot) and I have drawn in a Black Top Line and a parallel Black Line at the bottom - note the Top Line has about 7 ‘touch points’ but the Bottom Line is merely a parallel jobbie - it may be wrong. Assuming my Black Parallel Uptrend Lines are correct, then the falls over the last 10 Weeks are really just a Retracement within the Major Uptrend - that’s what I think is going on here. My Green Circle is highlighting a Big Red Down Candle which was created last week - this is obviously not a great thing for Bulls but in the context of the ‘Retracement’ I don’t feel a need to get overly concerned. Support around $1300 is next up and I suspect this will probably fail - in which case we go down to around the $1270 level - where my Bottom Uptrend Line is - that will test how correct my Bottom Uptrend Line is. Having reviewed these Charts, I am happy to keep my Bearish Stance and keep the Shorts well in place - Autumn is a difficult time of Year and I feel a need for protection. That’s it for now, have a great Weekend, what’s left of it and think of me in the PUB (in fact it will be a GNK !!). Bottoms Up !! WD 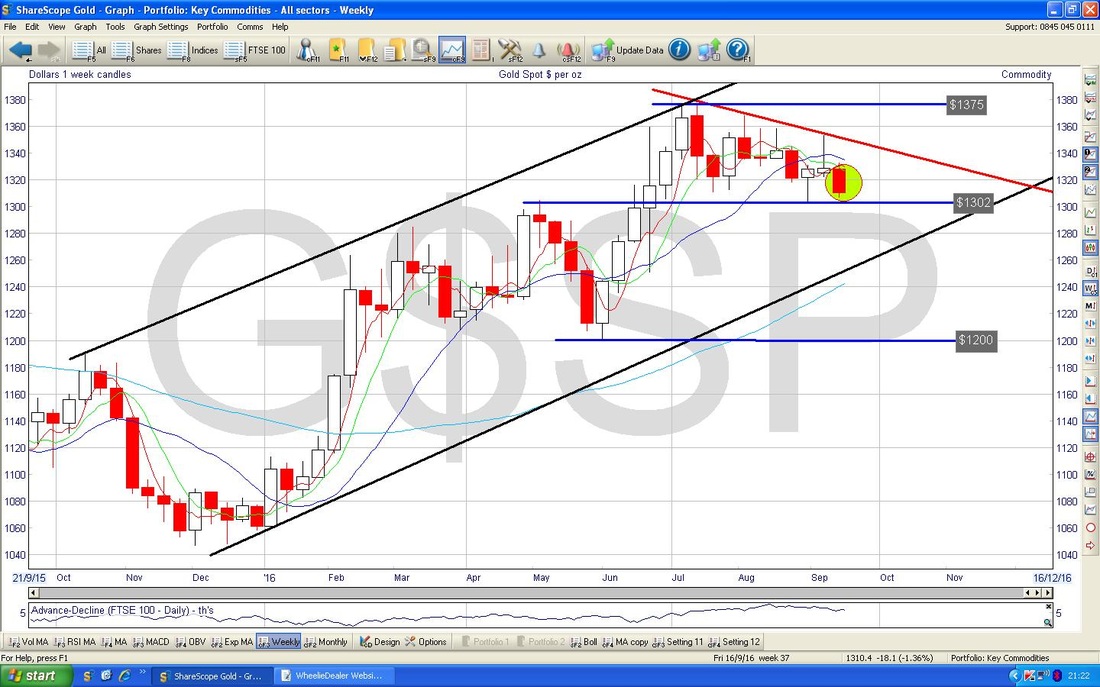
0 Comments
Leave a Reply. |
'Educational' WheelieBlogsWelcome to my Educational Blog Page - I have another 'Stocks & Markets' Blog Page which you can access via a Button on the top of the Homepage. Archives
January 2021
Categories
All
Please see the Full Range of Book Ideas in Wheelie's Bookshop.
|
