

|
educational blogs |
|
If feels like we are getting to the home stretch on the US Presidential Election marathon with slightly over 2 weeks to go - Markets seem to have been pretty subdued for most of October and sort of going Sideways so maybe we will see more of this although I would guess a slow drift downwards might be more likely. To an extent it might depend on what happens in the Polls - if Trump closes the gap a bit that might be all it takes to get Markets quite worried that he will get into the White House. If the Gap in the Polls stays like it is, then maybe Markets can stay quite stable as they anticipate a Clinton win which I reckon would be the ‘Status Quo’ candidate, however, if such a Victory is pretty much expected (and therefore largely priced in to the Markets) then perhaps Investors/Traders won’t be ‘Rockin’ All Over the World’ much.
I would expect a small rise if Clinton gets in but it would probably fizzle out quite soon - there are huge Macro issues on the near Horizon with a US Rate Rise in December probably being the one that will cause the biggest problem for Markets - whether or not it will mean a big collapse is pure guesswork but Markets seem very overvalued to me and I don’t think it would take much to spook them. The Danger in Markets continuing to rise is that they will just get more and more overvalued and it could be like when you stretch an Elastic Band that as you pull it more and more, the final ‘Snap-back’ is more extreme and more violent.
We have almost got through the difficult months of September and October without a scrape which is perhaps something to be positive about but the big immediate Risk has to be The Donald getting into Power - I think this would trigger a huge Sell-off, especially if it was a surprise result; and after the shock of the Brexit Vote and the increasing fallibility of Polls to predict outcomes reliably, it is perhaps more likely than many people think. This would be hard to play. If we see Markets falling a fair bit before the Result, then this would perhaps take out the sting of a Shock Trump win but we would maybe see Markets fall nonetheless. If Markets carry on Sideways or even upwards, then a Shock Result could be an absolute killer. This creates a big challenge for me as I have these Huge Short Positions that I really want to get out of ASAP - I think I will have to monitor the situation closely leading up to the Election Results and react to what happens. Most likely, if we get a drop before the Result, I might try to reduce my Shorts so that a Clinton Win doesn’t hurt me a lot by causing a big jump in the Indexes - that would really not be pleasant if I keep my Shorts at the current Huge Size. If Markets go sideways or rise a bit, then maybe I will just keep the Shorts I have and make sure I am prepared for a jump - remember, these are Hedges so to a large extent my Long Portfolio of Stocks should rise to offset any Hit from the Shorts. We shall see….. Further out looking into 2017, the big Risk has to be the triggering of Article 50 by the UK Government to kick off the Brexit process - I still get the sense that Markets are a bit in denial about this and maybe even think that it will not happen. If this is the case, then the actual Triggering could cause big ructions in UK and European Indexes and of course in the Pound. With Markets overvalued and toppy, it wouldn’t take much to knock them off their Perch and I struggle to see how UK and Europe can avoid at best a Slowdown in their Economies or at worst a proper Recession (indeed, I have already seen several ’Experts’ starting to suggest that a Recession might not be far away). With or without Brexit I think a Slowdown is getting due anyway - we are now 7 or 8 years since the last Recession and the Economic System seems very fragile and unable to take Shocks, and of course Central Banks have no firepower left to try to inflate Economies and governments lack much room for Keynesian Fiscal Stimulus and it is doubtful this kind of thing helps much anyway - look at Japan if you want to see how both Fiscal and Monetary Policy have failed miserably for 20 years. Anyway, as you can see I think we face some tough times and Safety is the name of the game - Risk Takers have been rewarded during 2016 so far but there are certainly no guarantees this can continue and I will be continuing to proceed with Caution. Enough already, let’s check out the History and the Charts……. Historical Backdrop According to the UK Stockmarket Almanac 2016, the coming Week (w/c Monday 24th October) is Up for 48% of years and the Average Return is MINUS 0.2% - so it doesn’t have a great record but looks pretty flat really. FTSE100 As usual, here is a quick reminder of the important Big Picture view of the FTSE100 with the main thing to note being the Long Term Uptrend Channel marked by my Parallel Red Lines. Note also the Blue Line which could also tell us something useful, as we will see on the next Chart when we zoom in. 
The Chart below zooms in to about the last 4 months and shows the Daily Candles as usual. Note how the Price got over the Bottom Red Line of the Uptrend from the previous Chart in early October but that it has since dropped back and is now just about below the line although it has made attempts to get over it intraday. Note also my Green Arrow which is pointing to a Red Down Candle with a Long ‘Tail’ that touched the Blue Line intraday and that former Resistance Line became Support as it should do. The bottom of this Tail is at 6930 and on the Downside it is important for this to hold as Support.
My Black Arrow is pointing to an Inverted Hammer Candle which was created on Friday 21st October - in this Context an Inverted Hammer isn’t so terrifying as it would be after a clear run up, but even so it isn’t a great show of strength that the Price has been unable to hold Intraday Highs and there is Resistance put in at 7058 which needs to be got over. If this can be cracked, then 7100 will most likely act as Resistance and then of course we have the All Time High (ATH) at 7130 - this could be Strong Resistance but if it gets broken over, then the FTSE100 should in theory go much higher. With the US Election imminent, I suspect that maybe we will be in a Sideways Range now for a bit - the obvious Range would be from 6930 to 7058 - perhaps that will give us a big clue on the future direction - it if breaks out to the Upside then we will probably go higher, but if it falls below the Range, then it suggests more moves lower. As you will see later on, Oil looks possibly a bit weak in the short term and the Pound looks like it has found Support - both of these are unlikely to help the FTSE100 go higher. In fact, if the Pound can go higher and Oil falls, then that could cause the FTSE100 to drop if recent correlations hold. 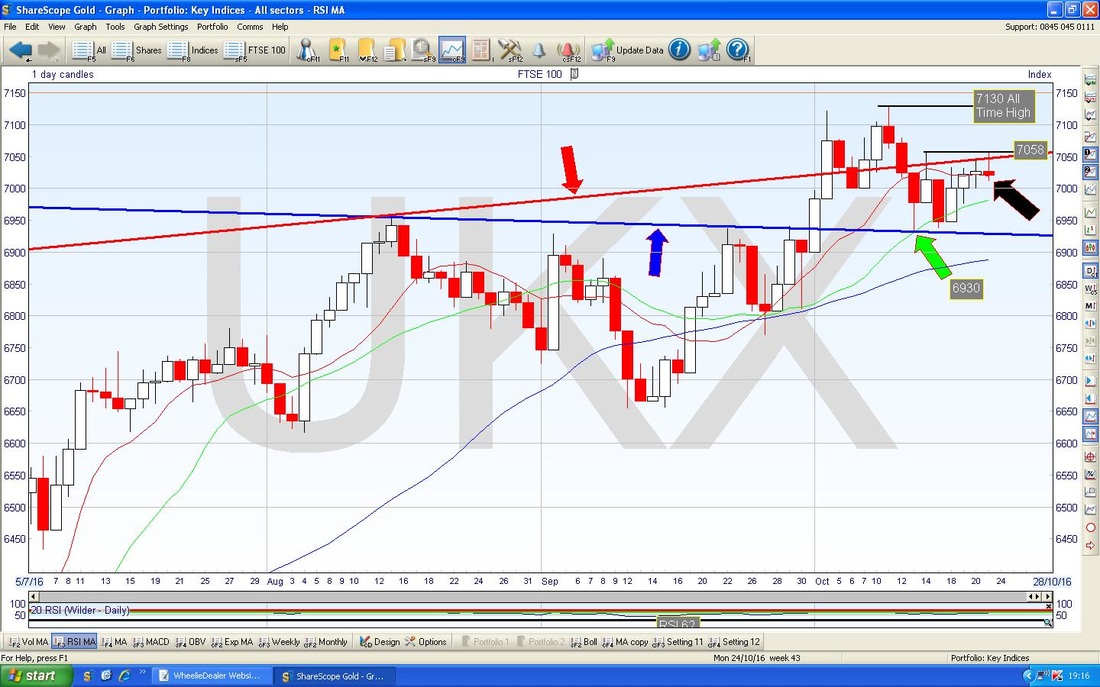
The Chart below has the Weekly Candles for the FTSE100 going back about a year and a few months. My Black Arrow is pointing to a Doji Candle that was produced last week and note this is slightly below the Long Tails Doji from the week before which is captured in my Yellow Circle. This is not particularly ‘clean’ but it is possible that the Long Tails Doji is a Turning Point - we really need this week coming to show us the direction from this setup.
Note I have moved up the Blue Top Uptrend Line on this Chart. In previous weeks it was lower and no doubt people will accuse me of ‘Line Fixing’ but I think this is valid. If I am right, then this Blue Line could cap any moves to the upside. 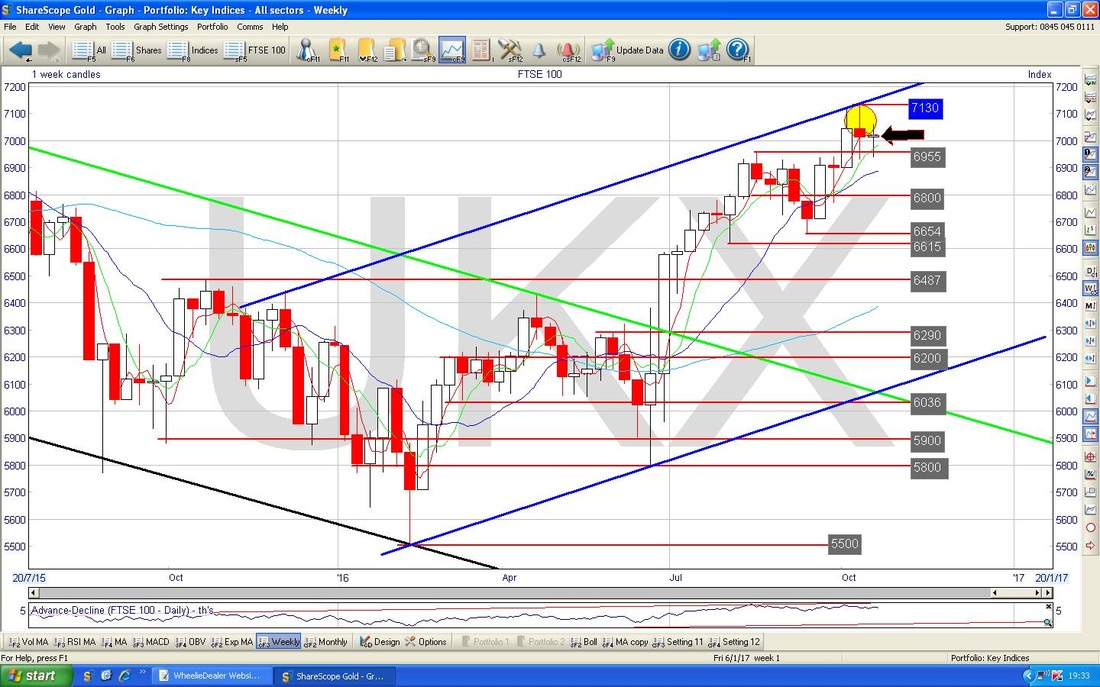
I haven’t bothered with showing any other Charts for the FTSE100 like MACD, RSI, Overbought/Oversold etc. because they are all pretty neutral - they are not telling me anything of use - which has been the case for many days recently as we seem to be going sideways really.
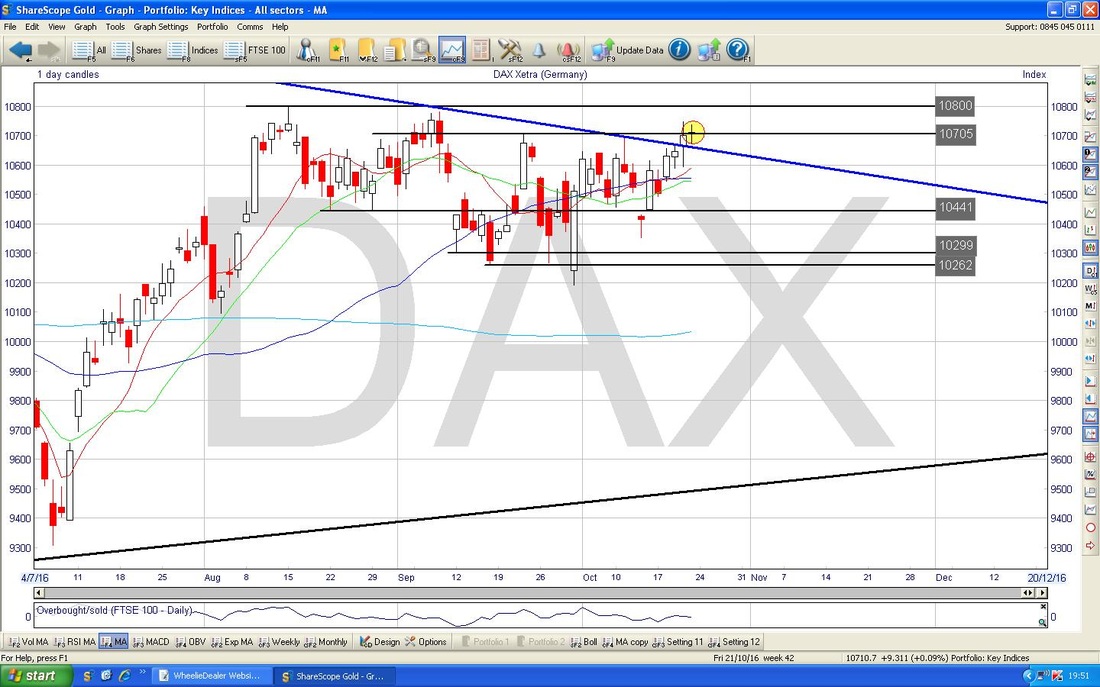
DAX (German) The Chart below is a bit similar to the one I showed on the FTSE100 in the Big Picture - note the Uptrend Channel and my Blue Line which has recently been broken over as I will show next. 
The Chart below has the Daily Candles for the DAX and zooms in to about the last 4 months roughly. My Yellow Circle is highlighting the Doji Candle which was created on Friday and this suggests that the recent move up might be running out of puff - when you get a Doji, neither the Bulls nor the Bears were able to take control and have the upper hand. Note how this Doji and a big part of the Candle from the day before are both above the Blue Line which was previously Resistance - it will now be interesting to see if this holds as Support or if the Price drops back below it. There is Strong Resistance up above at 10800 but if the Price can break over this, that would be very Bullish.
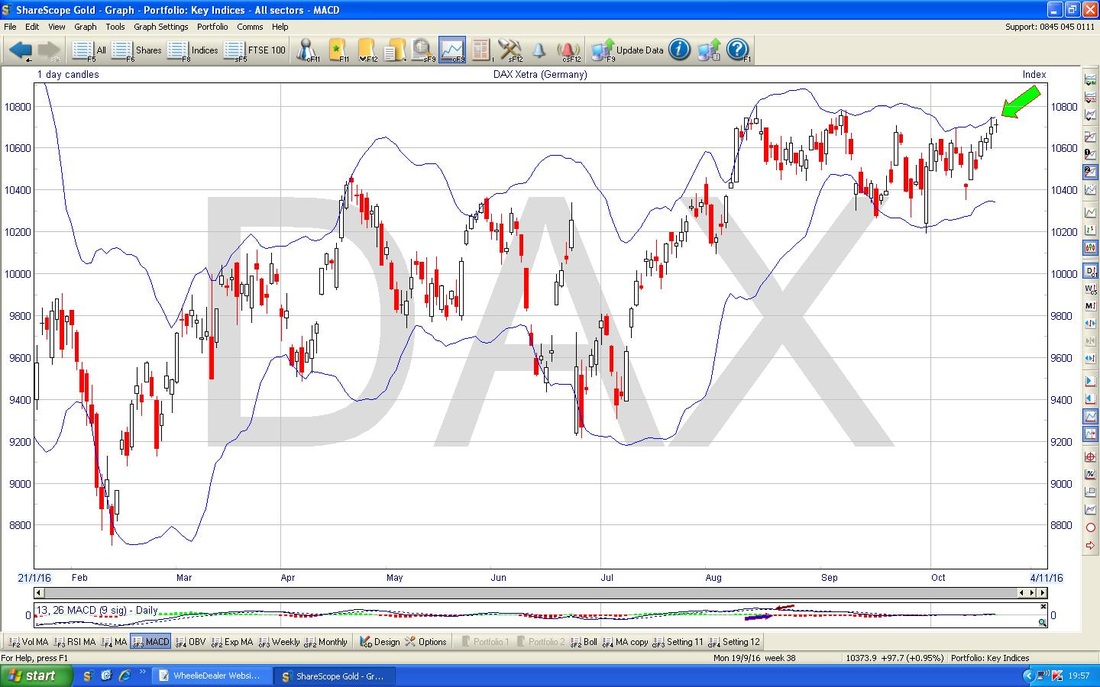
The Screen below (all these ScreenShots are from the sublime ShareScope Software I use) has the Daily Candles for the DAX with the Bollinger Bands both below and above the Price Line. My Green Arrow is showing where the Price has got up near the Top Bollie Band and maybe this will cap any gains in the short term.
S&P500 (Probably most important US Index)
The Chart below has the Daily Candles for the S&P500 going back about 5 months. The main thing to note here is how the Price broke out to the downside out of the Triangle marked by my Blue Lines (and marked again by the Blue Arrows !!) - I showed this over recent weeks. It looks to me now like the Price Action will probably go sideways - maybe there will be a Range between about 2120 at the bottom to about 2150 at the top - any Breakout of this Range would give the future direction. Note my Small Black Arrow which is showing where the Red 13 Day Exponential Moving Average did a ‘Death Cross’ against the Green 21 Day EMA - the predictive power of this crossover in this case is very clear. As with the FTSE100 etc. none of the other Indicators are telling me anything clear and useful. 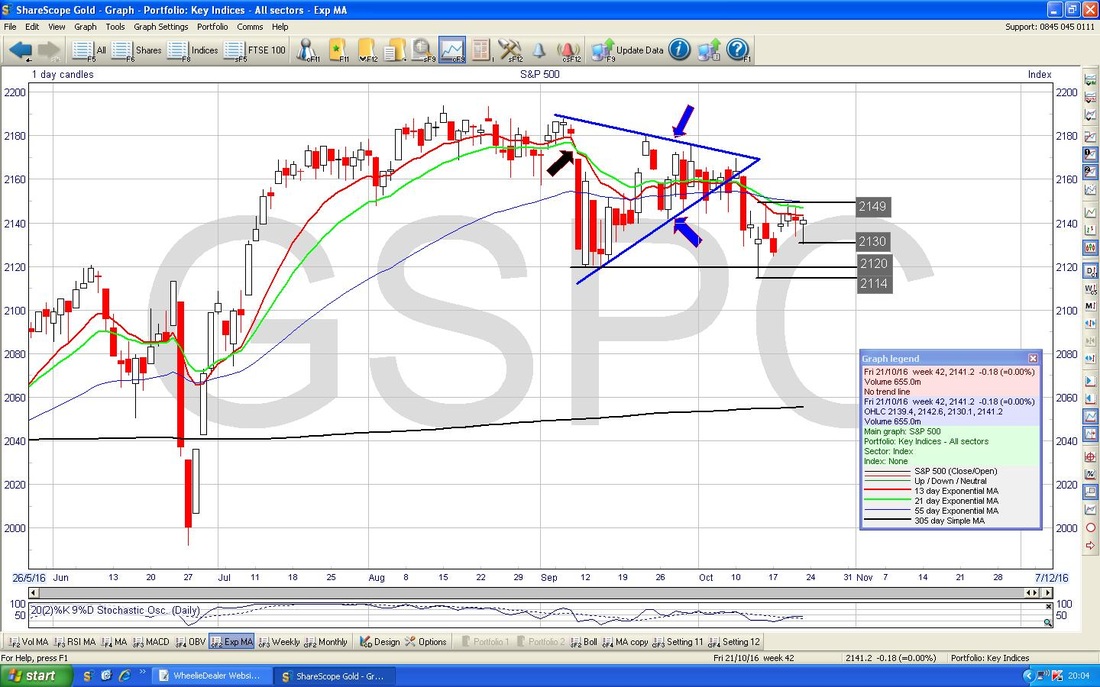
Nasdaq 100
This is a US Technology Index - note it is not quite the same as the Nasdaq Composite Index which has a load more Stocks in it, but they track fairly closely anyway. I am interested in this one because it is the only way I can short the Nasdaq (which I think is crazily overvalued) using Spreadbets with igIndex. The Chart below has the Daily Candles for the Nasdaq 100 going back about 4 months. My Green Arrow is pointing to an Up Candle from Friday which turned up off the sort of Hammer / Dragonfly Doji of the day before. The level to watch now is 4861 which is Resistance just up above. If this is broken over, then the next Resistance is up above at around 4890 and then at the All Time High of 4905. This Index is clearly much stronger than the S&P500 (and the Dow by the way) but if we see a big drop as a result of the US Election, I cannot see how the Nasdaq can escape such falls. 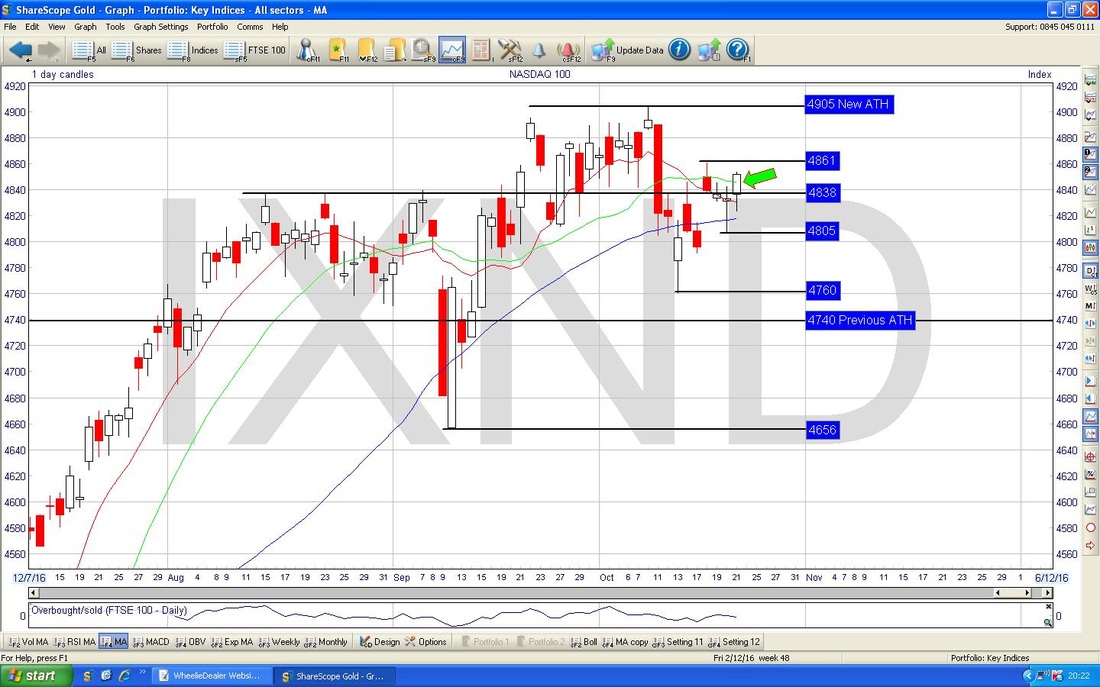
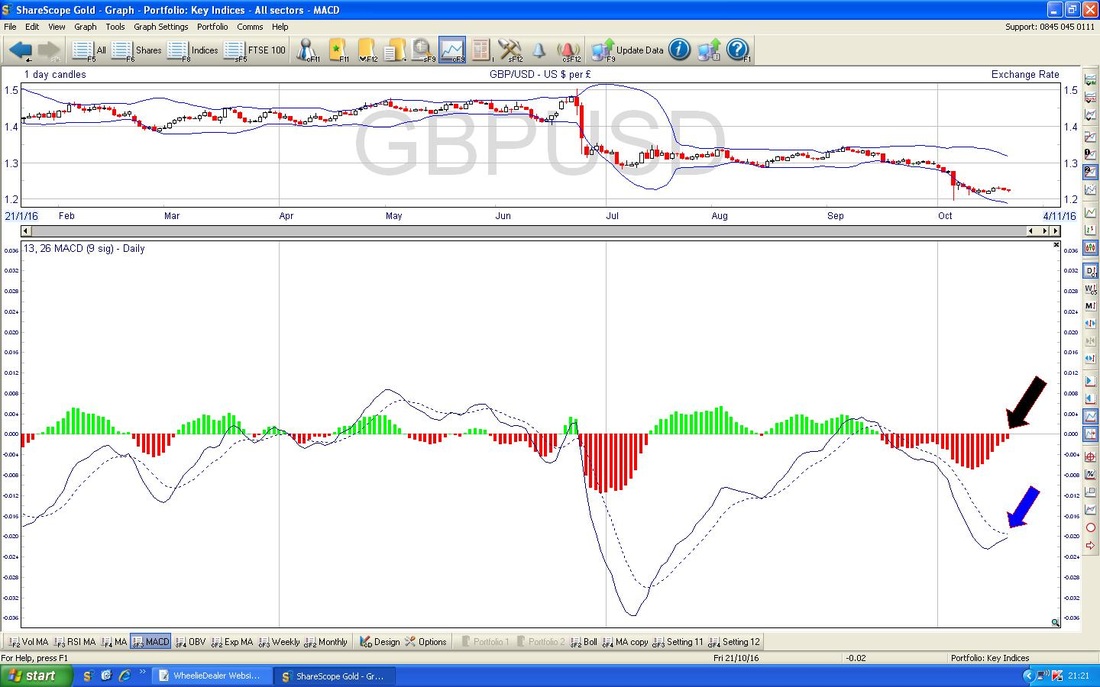
Pound/Dollar
This is obviously of interest because it has been having a big impact on the FTSE100 - although of course any recent Correlation doesn’t necessarily have to continue. My Blue Arrow is pointing to a small Hammer Candle which was produced on Friday and the Low here is 1.2171 which is now Support to watch. To the upside, Resistance at 1.2333 is now in play which was generated from Wednesday 19th October. I have seen much talk about the Pound going lower etc. etc. etc., but as long as it can hold above 1.1947 then a further plunge is avoided. 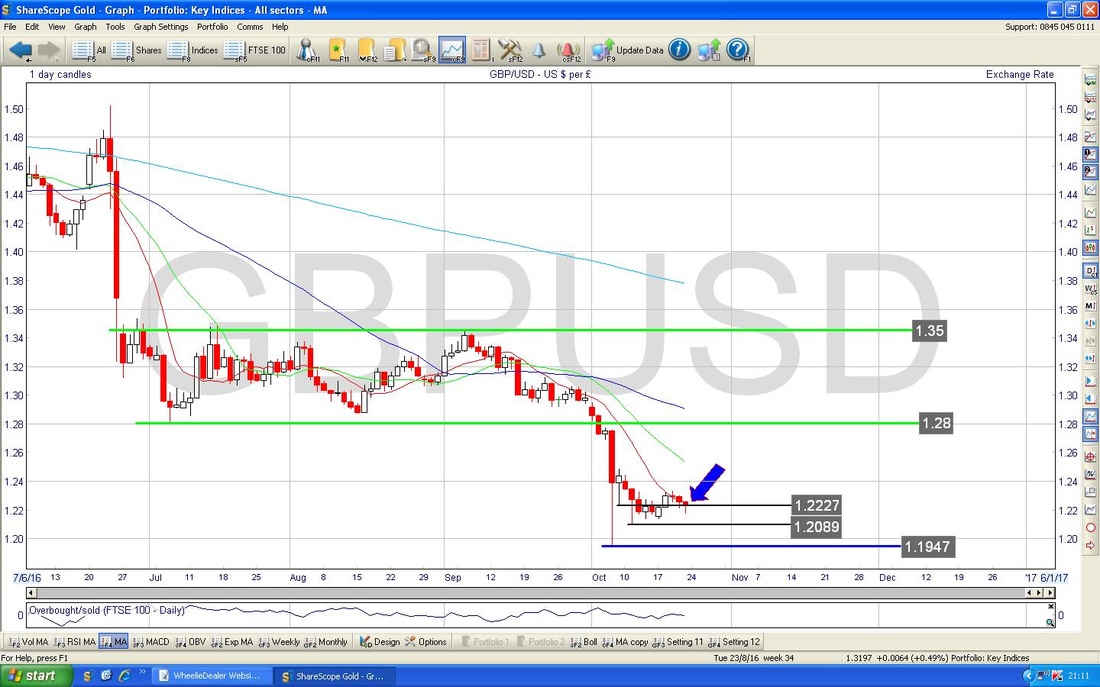
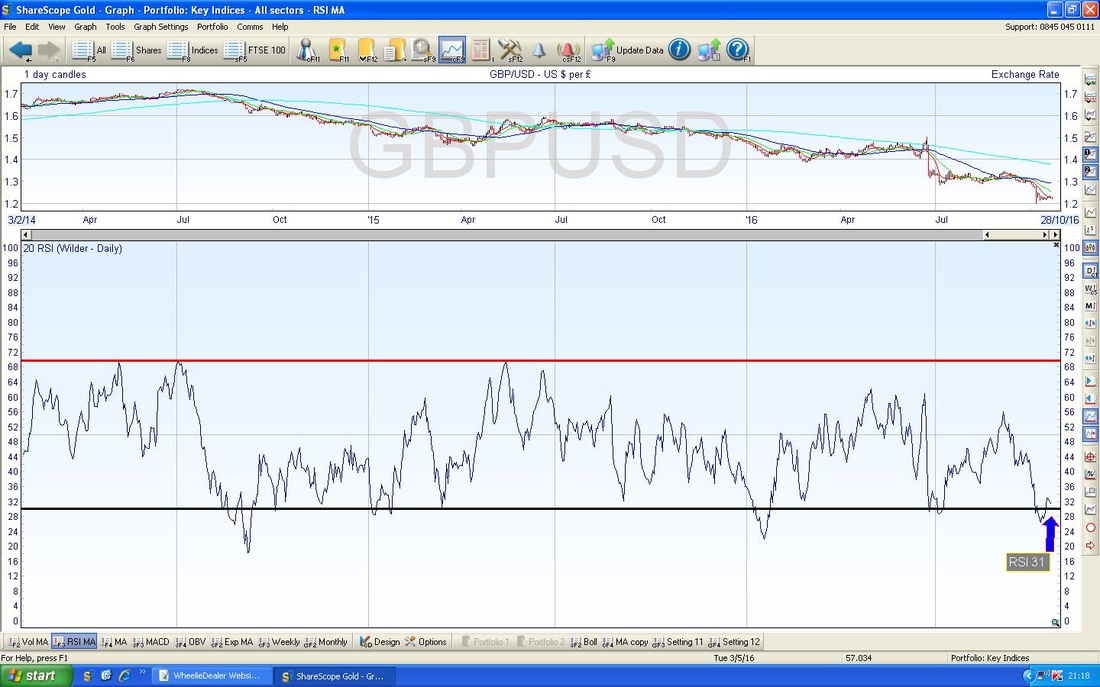
The bottom window of the Screen below has the RSI (Relative Strength Index) for the Quid/Buck - note a reading of RSI 31 which is really low.
The bottom window of the Screen below shows the MACD (Moving Average Convergence Divergence) for £/$ - my Black Arrow and Blue Arrow are both showing the same thing but in a different form of representation - the upshot is that we are looking at a Bullish MACD Cross very soon although of course it could ‘glance off’ to the downside. This should become apparent in the next couple of days.
Brent Oil (Spot)
The Chart below has the Weekly Candles for Brent Crude Oil (Spot) going back about nearly 2 years. There are quite a few things to note on this Chart - firstly look at the Horizontal Black Line (marked by my Black Arrow) at $54 - this is the critical Resistance Line that needs to be broken over. If the Price can do this, then my Big Green Circle in the Top Left Hand Corner highlights a thick area of Resistance from about $60 to $70 which will be very hard to get through. Note $70 looks a very Strong Resistance Level and I have marked this with the Horizontal Red Line (marked by the Red Arrow). My Small Yellow Circle highlights the 2 Candles produced over the last fortnight and both of these show where the Price was unable to hold Highs of the Weeks - it seems likely we might turn down off these in the short term. Note the Green Upwards Sloping Support Line (marked with my Green Arrow) - this must hold - if the Price falls substantially below this Line then there is trouble ahead. 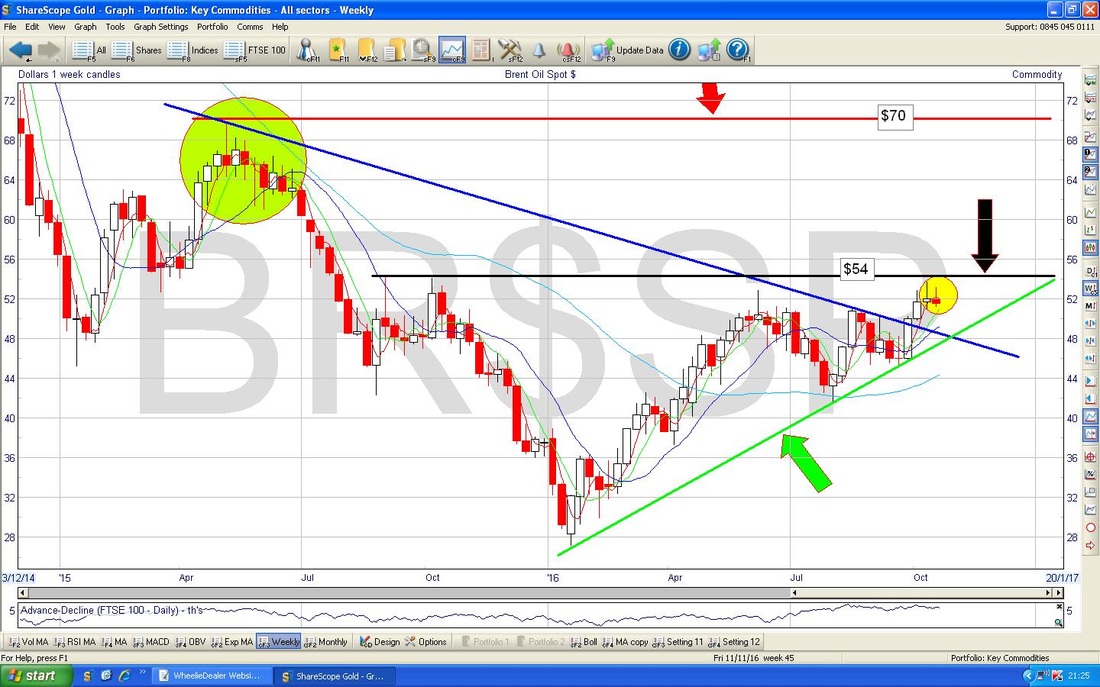
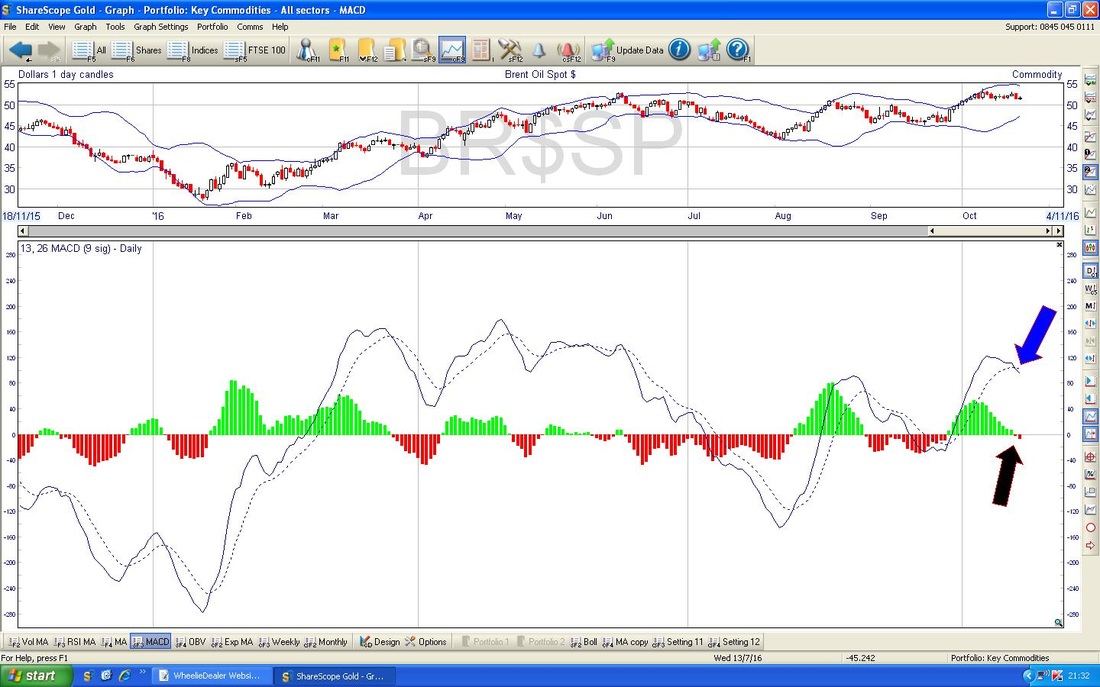
In the bottom window on the Screen below we have a Bearish MACD Cross for the Brent Oil (Spot) Daily.
Gold (Spot)
The Chart below shows the Weekly Candles for Gold (Spot) going back about 1.5 years. Note the 2 Parallel Black Lines which mark an Uptrend Channel which was in place for about most of 2016 - but note how the Price dropped outside it just in the last 3 weeks. My Green Arrow is pointing to a White Up Candle which was created last week, but note how it has a ‘Wick’ which actually went up and touched the Bottom Black Uptrend Channel Line - this might be telling us that the Black Line is acting as Resistance at about $1275. Also note how the Up Candle last week followed the Red Doji ‘Spinning Top’ from the Week before - this seems to have acted as a ‘Pivot Point’ after the recent Falls, but can it last? My Blue Arrow is pointing at the very Faint Light Blue 200 Day Moving Average Line - note how the Price is pretty much hovering around this line. 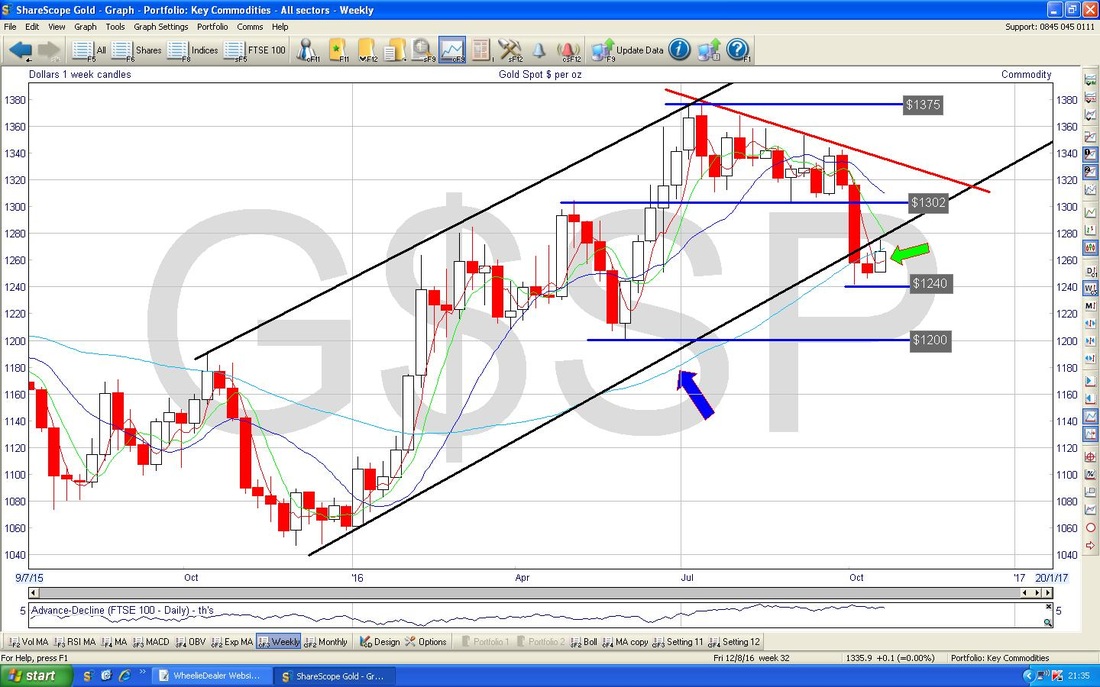
In the bottom window below we have the MACD for Gold Spot Daily - note how it has just done a Bullish MACD Cross.
That’s it this week, hopefully something more clear-cut will happen on most of the Indexes and stuff next week - nothing worse than all this Sideways nonsense……. Cheers, WD. 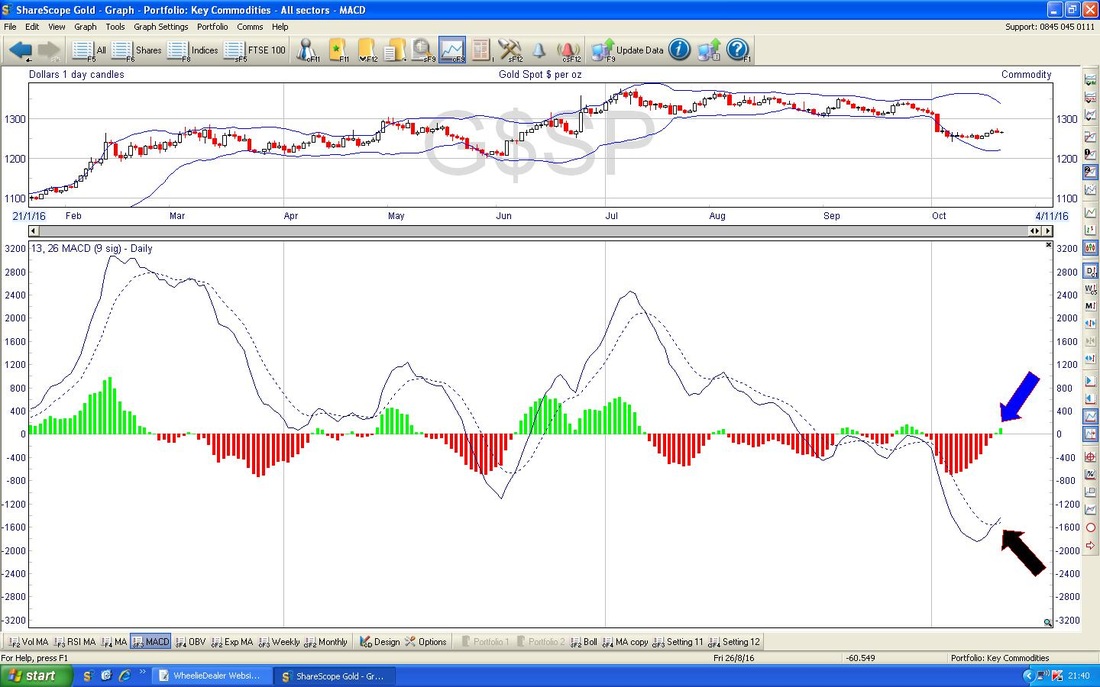
2 Comments
Daniel Victor
31/10/2016 05:01:43 am
There's just an outside possibility that if this corruption scandal were to really blow up, Hilary might be forced to bow out of the race.That would be good for Trump,but bad for the markets short-term
WheelieDealer
31/10/2016 11:23:01 pm
Hi Daniel, Leave a Reply. |
'Educational' WheelieBlogsWelcome to my Educational Blog Page - I have another 'Stocks & Markets' Blog Page which you can access via a Button on the top of the Homepage. Archives
January 2021
Categories
All
Please see the Full Range of Book Ideas in Wheelie's Bookshop.
|
