

|
educational blogs |
|
DO NOT BASE TRADING DECISIONS ON THIS TEXT - THIS IS MERELY FOR YOUR DELECTATION AND DELIGHT Something a little different for everyone tonight - instead of doing a textual list of various obscure Technical Indicators, I thought I would pick out some Key Charts on the Various Indexes. Summary FTSE100 still looks uncertain and either the Bulls or the Bears could win out in the short term. However, if the Bulls win, they won’t be able to drag it far. We might see 7000 soon though…… US Markets look like they may go higher in coming days, but they are getting stretched to the Upside. Europe looks very Overbought and due a fall. Gold still looks bullish and Brent Oil ok but may pullback a little. I have 35% ish Short FTSE100 Hedges against my Long Portfolio. Details on Trades page of this Website, happy to sit tight as markets feel very complacent and I am 65% Long. **If you want more detail on understanding these terms, go to my Blog Page and click on ‘Buy Rationale’ or ‘Technical Analysis’ categories and you should get my ‘OPAY Buy Rationale’ series which covers these Technical Indicators in depth with lots of example Charts.** FTSE100 The bottom Window shows the RSI (Relative Strength Index) - 70 is Overbought and as you can see we are near that level and also this is a level from which it has dropped for most of the last 2 years. We can go higher, but not a lot. 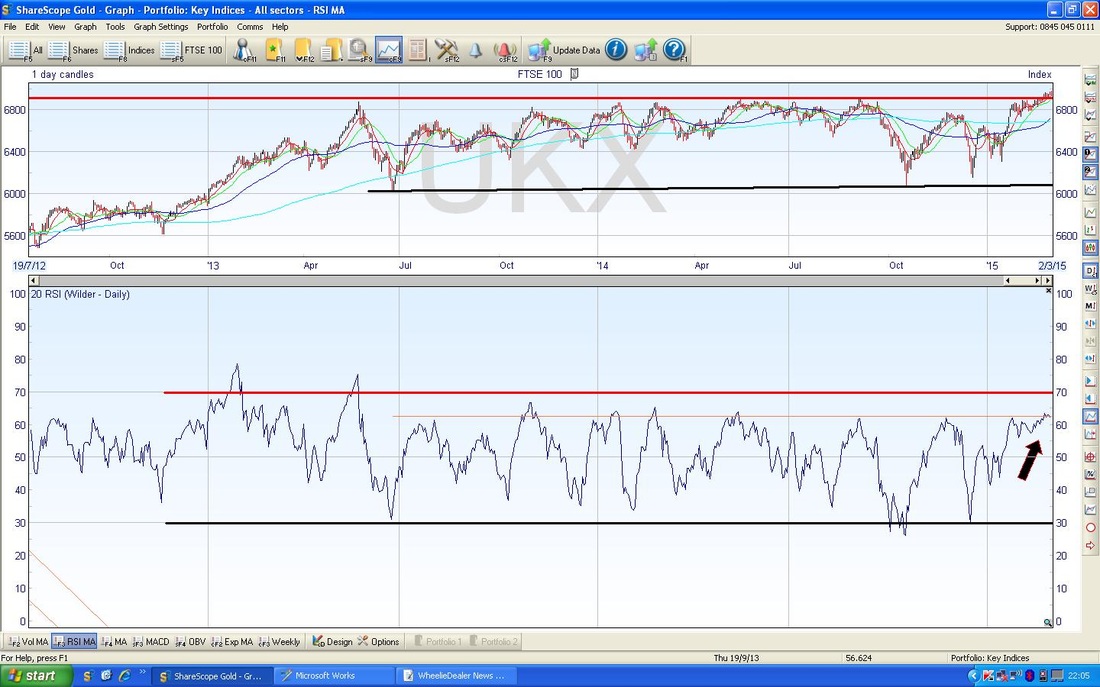
Look at the Black Circle on the Chart Below over on the Right Hand Side. I have marked the 2 Doji Candles from Friday and Monday (today) - these are Reversal Indicators in the context of the recent run up and suggest that FTSE100 could fall soon. The Black Arrow is more Bullish as this points out where the 50 day Moving Average and 200 Day Moving Average have done a Golden Cross - this is a Medium Term Indicator really and means we could still get short term falls (days) but still be in a Medium Term uptrend (weeks). 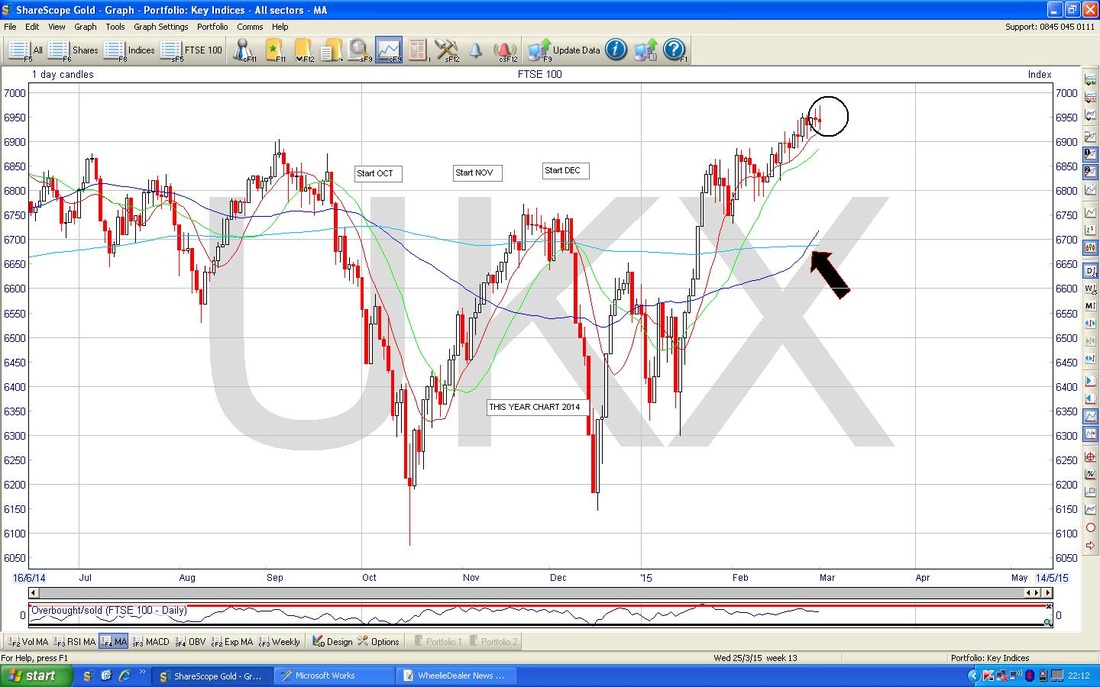
Chart below shows the Bearish Divergence on the OBV (On Balance Volume) in the bottom window. Note how the Red Line I have marked slopes downwards whereas the corresponding Price Line in the top window slops upwards - this is what is meant by Divergence. 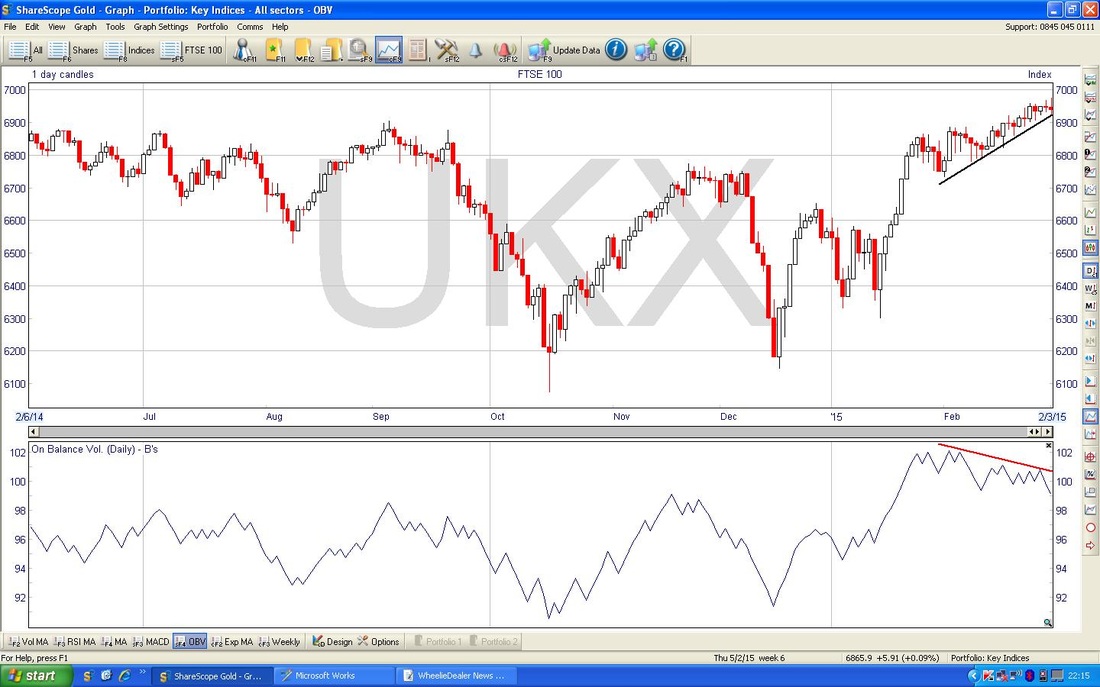
DAX In the chart below I have circled a beautiful Doji - this is very Bearish in the context of the recent up moves. 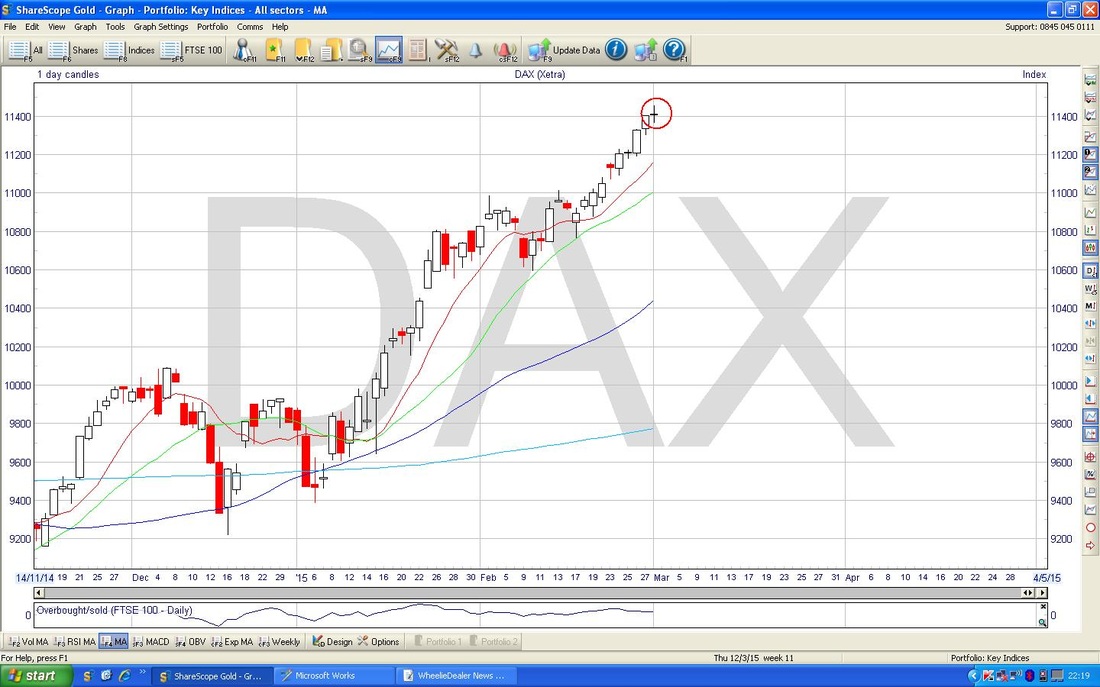
The Chart below shows the RSI in the bottom window. The Black Arrow highlights where we are today and the Red Horizontal Line shows the highest levels reached in the last 5 years !! Not much room left to rise here !! 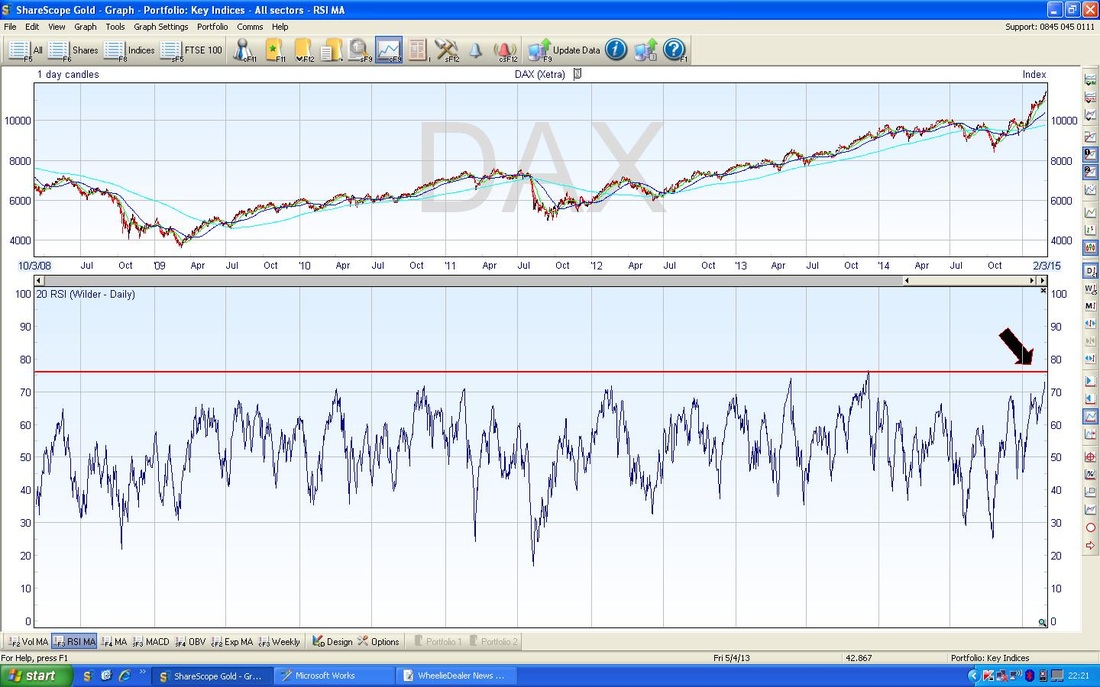
The Chart below shows how stretched the Price Line is from the 305 day EMA (Exponential Moving Average) - it will Mean Revert soon. 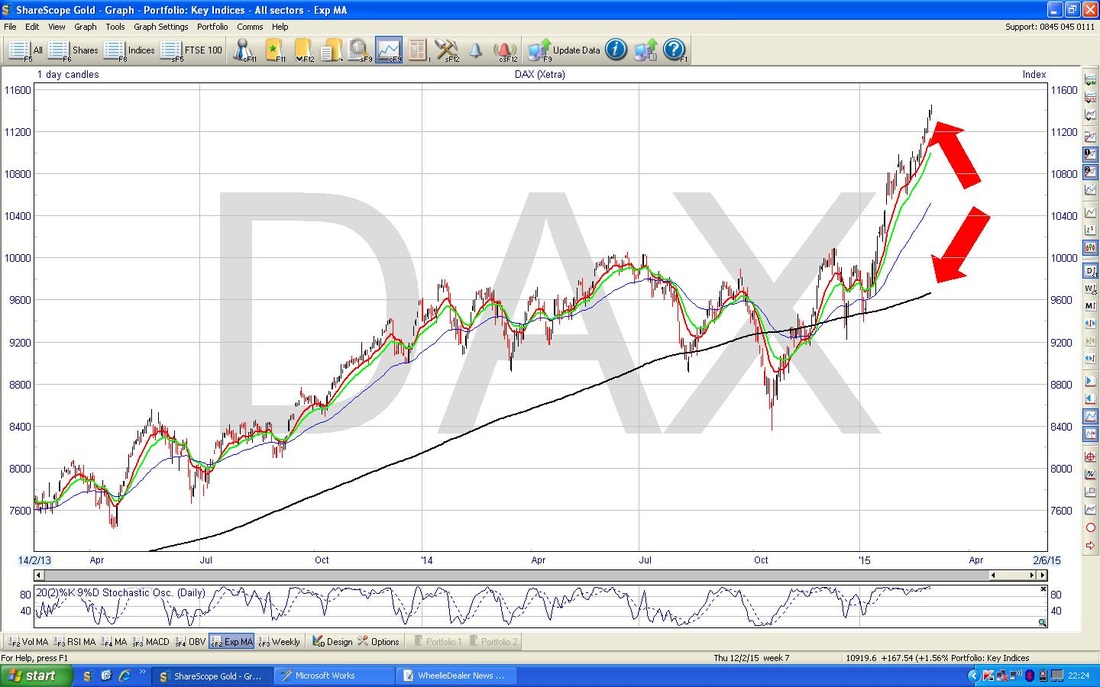
Nasdaq Composite The Chart below shows the Bollinger Bands (the blue wiggly lines) in the top window. My Black Arrow highlights how the Price has move away from the Upper Bollinger Band - this is bearish behaviour. The bottom window shows the MACD (Moving Average Convergence Divergence) - note how the Green Histogram ‘hump’ is rolling over, just below the Blue Arrow. 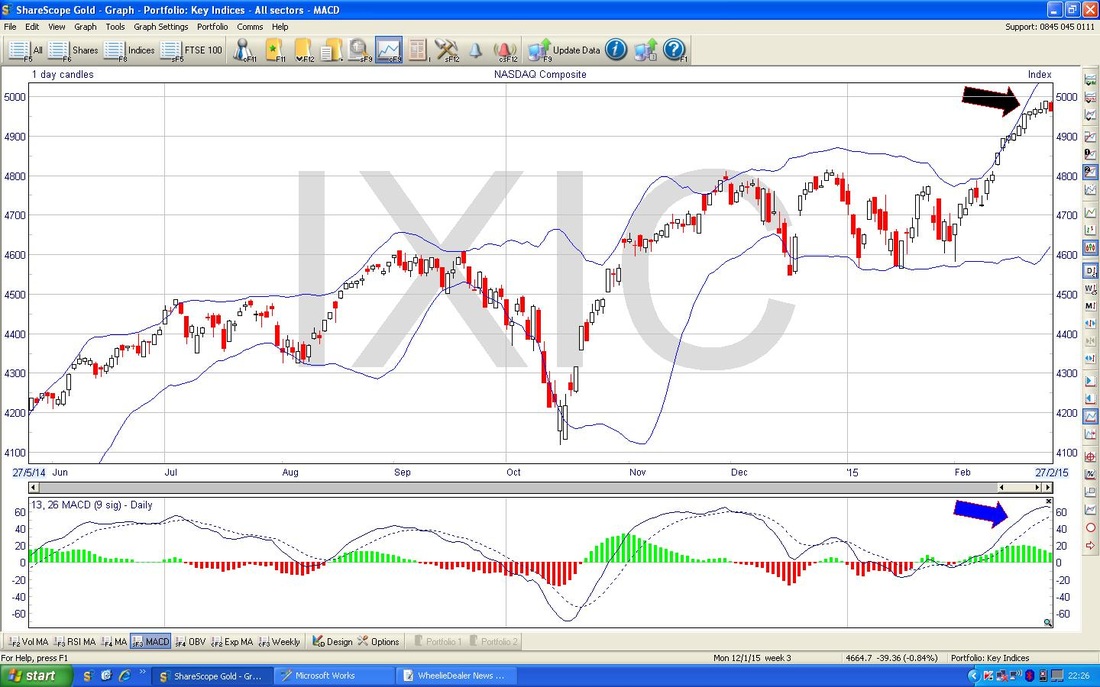
Nice Big Up Candle today which is bullish. However, note high RSI as marked below with the Blue Arrow - not much room to go up. 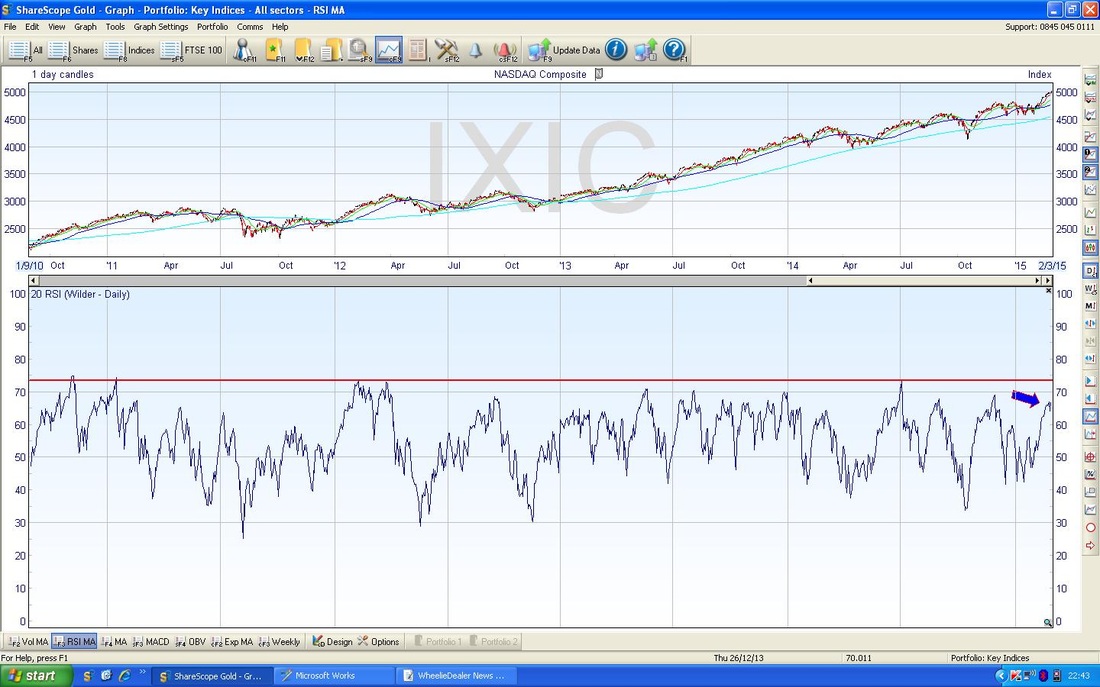
Gold Similar to the Nasdaq above, look at the Black Arrow in the top window of the chart below. This shows the that Price has moved away from the Bottom Bollinger Band in this case - this is a bullish development. Note in the bottom window that on the MACD the Red Histogram is about to go Green and turn positive - this is bullish. 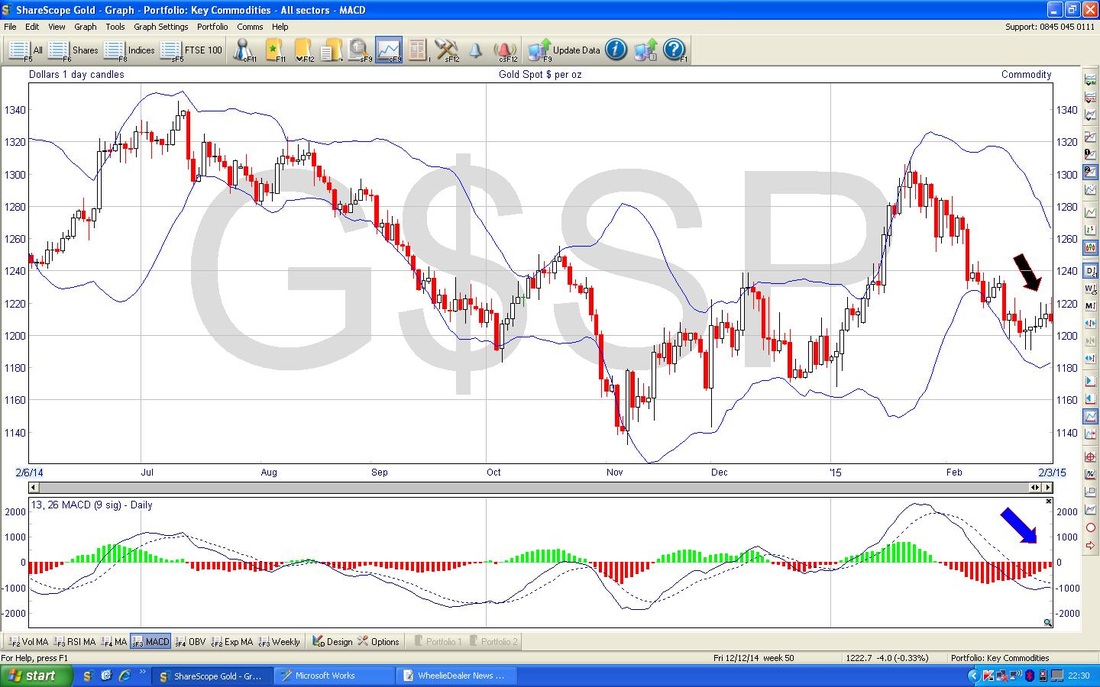
S&P500 We got a lovely Up Candle today which should wipe out the weakness of the last 3 days last week. However look down the bottom and you will see not a lot of volume behind the move up - I have marked this with the Blue Arrow. 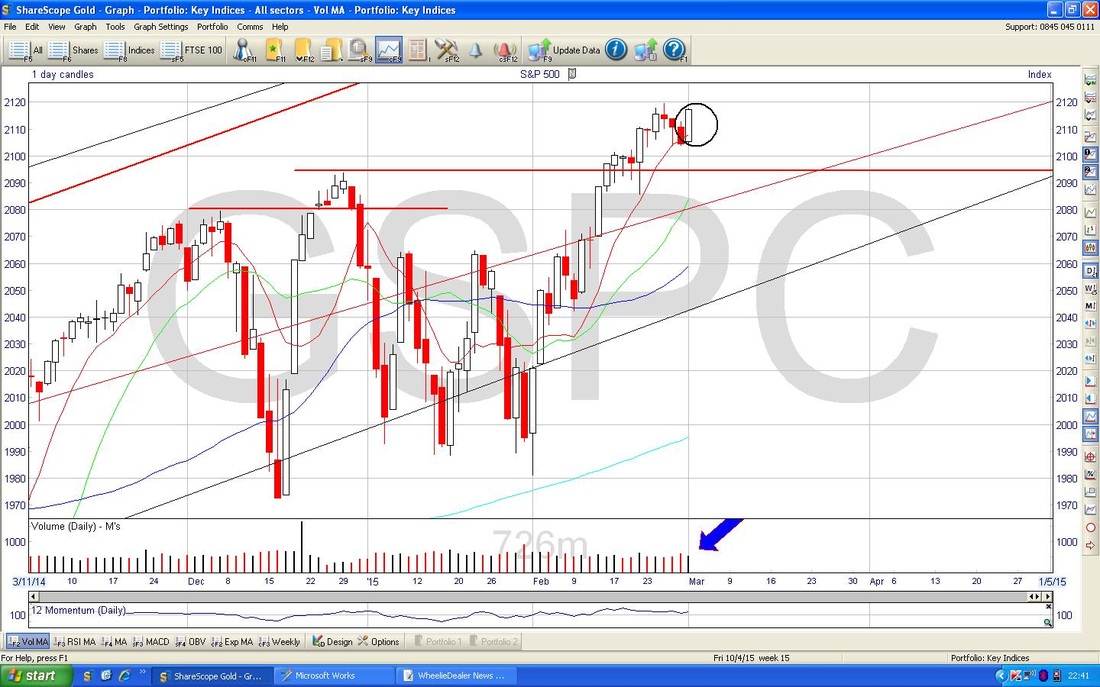
2 Comments
14/12/2016 06:49:57 am
My guess is that you hate plagiarism. You're a good writer, and any time you create an article, a blog post or any other bit of writing, you do your best to craft a piece that is as succinct and clear as possible. In fact, I would go so far as to say, that your propensities are closer to perfection than anything else. Given the fact that plagiarism is anathema to you, what could possibly be the problem with web sites that check for it? In this article I'll share that with you. 16/12/2016 10:36:17 am
There is simply no need to say that an MBA program is the master-key to your bright future, glittering with loads and loads of opportunities Leave a Reply. |
'Educational' WheelieBlogsWelcome to my Educational Blog Page - I have another 'Stocks & Markets' Blog Page which you can access via a Button on the top of the Homepage. Archives
January 2021
Categories
All
Please see the Full Range of Book Ideas in Wheelie's Bookshop.
|
