

|
educational blogs |
|
Dunno what it’s like where you are but Windsor is positively arctic today - I hate cold and I’m desperate for the Winter to relent and let’s get on with the nice bits of the year !! On that matter we are already pushing towards the back end of January and after so much strength in the Markets we had a bit of a pause last week and it will be interesting to see if Markets do ease back more or if the incredible upwards momentum can continue.
As I have mentioned many times I see the Elections around Europe as being the big risks facing us in 2017 of a downwards variety but in terms of what can keep the Rally going there is clearly a lot of belief that the Trump Jump will continue as his policies energise the US Economy. I see this as a very interesting experiment because I have long felt that Western Economies were stifled by over-regulation and his intention to only bring in a new regulation if 2 other regulations are removed is the kind of thing I suspect would really help European Economies in particular to regain some vitality and dynamism. Of course the main negative impact of over-regulation is the entrenching of Big Businesses and the smothering of new Business ideas that struggle to get traction.
The other factor I will be monitoring closely is how successful Trump’s Infrastructure Spending turns out to be - or if it will even happen for that matter. My guess is that Trumpy will get his way on Infrastructure despite many in the Republican Party being very against increasing the US Federal Debt but when you have a Debt Mountain bigger than Everest it probably doesn’t make much difference to stack a Ben Nevis on top !!
Trump is clearly very driven to get his way and force his policies through and his team have been working on plans for the first 100 days of his presidency and I think I heard they have plans for the next 200 days as well. We can expect a flurry of Executive Orders (I understand these are where the Pres can force through Laws without Congress and the Senate being able to block them - Obama did a lot of this apparently and this is why many of his previous Orders will be easily reversed by Trumpy) in the first few weeks of Trump’s rule as he tries to show he is a ‘Man of Action’. But then the big question is will the Infrastructure splurge work? My suspicion is that it may fail miserably as similar attempts to energise a moribund Domestic Economy have done in Japan. The problem here is one of Debt most likely - when you have a Country that is more than ‘up to the eyeballs’ in Debt, adding to that Debt with more Spending is probably just going to make the problem worse and not bring about the boost to the Economy (and the consequent Economic Growth acceleration) that is hoped for. The simple reality is that Individuals and Businesses in the Economy know that more Debt-fuelled Spending by Government just ultimately means more Taxation in the future or more Inflation as a way of ‘magically’ making the Debt seem to disappear. I have long felt that Keynesian Spending Splurges can only work when an Economy has a small amount of Debt or perhaps is nicely in Surplus - of course Keynes’ ideas advocated building up a Surplus in the good times so that you could do a Spending Boost in the bad times - sadly Politicians have conveniently forgotten this in its full form. Anyway, that is all a long way off really and I doubt it will have much real impact on the US Economy during 2017 and it is likely that other Issues around Europe with regards to Elections, Debt problems, Brexit will be more of a drag on the Global Economy. In addition, any spats between US and China might cause some hiccups this year. Having said all that, I would not be at all surprised to see Major Stock Indexes (particularly the FTSE100 and the US Indexes) higher on the 31st December 2017 than they are now - the recent Breakouts to new All Time Highs are very bullish developments. Before we get to that though, it is worth noting that Western Economies seem to be performing rather well at the moment. The UK is growing much more strongly than anyone predicted and the US has been humming along nicely - so much so that The Fed is very likely to keep steadily raising Interest Rates. Even Europe is perking up and Germany has come out with some very good Economic figures recently. If these trends can continue then the backdrop for Stocks looks pretty good - of course a big Risk here is that Interest Rates start to rise if Economies do pick up speed but I suspect we are some way off this becoming widespread and Stocks can still rise in the early years of Rate Rises. Let’s get charting…… FTSE100 As ever, all the Charts are from the Award-Breaking ShareScope Software that I use to manage my Stocks every day. The Chart below shows the Daily Candlesticks for the FTSE100 going back 8 months or so - I have simply chosen this Timeframe as it fits nicely in terms of showing what I want to cover and making the Candles etc. a suitable size for Readers to see (by the way, if you want a closer view then click on the Chart and it should become bigger in a separate Window on your Screen). The key thing here is that there is immense Support just below where we are now. Let’s start with the Black Line (marked with my Black Arrow) at 7130 which was the All Time High for a few months and which we broke over back in the dying days of 2016 during the Santa Rally. This should be a strong Line of Support and I will be surprised if this fails and the Price goes lower. It is worth bearing in mind that textbook theory says that after a Breakout of Resistance (which 7130 was up until the end of December), that former Resistance should become Support - so if textbook theory is followed then the Price should fall back to around 7130 and then move up again - having ‘Confirmed’ the prior Breakout by doing this very normal bit of Price Action. The next Line of Support comes from the Red Line (marked with the Red Arrow) which is the Bottom Line of the Long Term Uptrend Channel which goes back to the 2009 Lows - I usually show this Uptrend on a separate Chart but I will give it a miss this week - if you want to see it then have a look at last week’s Charts Blog. Support from the Red Line kicks in at around 7150. If Support at 7130 fails, then there is Support just below from the 50 Day Moving Average which is the Blue Wiggly Line and this Support will come in around 7000. My Blue Arrow is pointing to a small ‘Inverted Hammer’ type of Doji Candle which was created on Friday 20th January 2017 - after a few Down Days last week, it is possible that this will be a Turning Point for us to resume the move upwards or at least it is warning us that the Falls may not be for long. 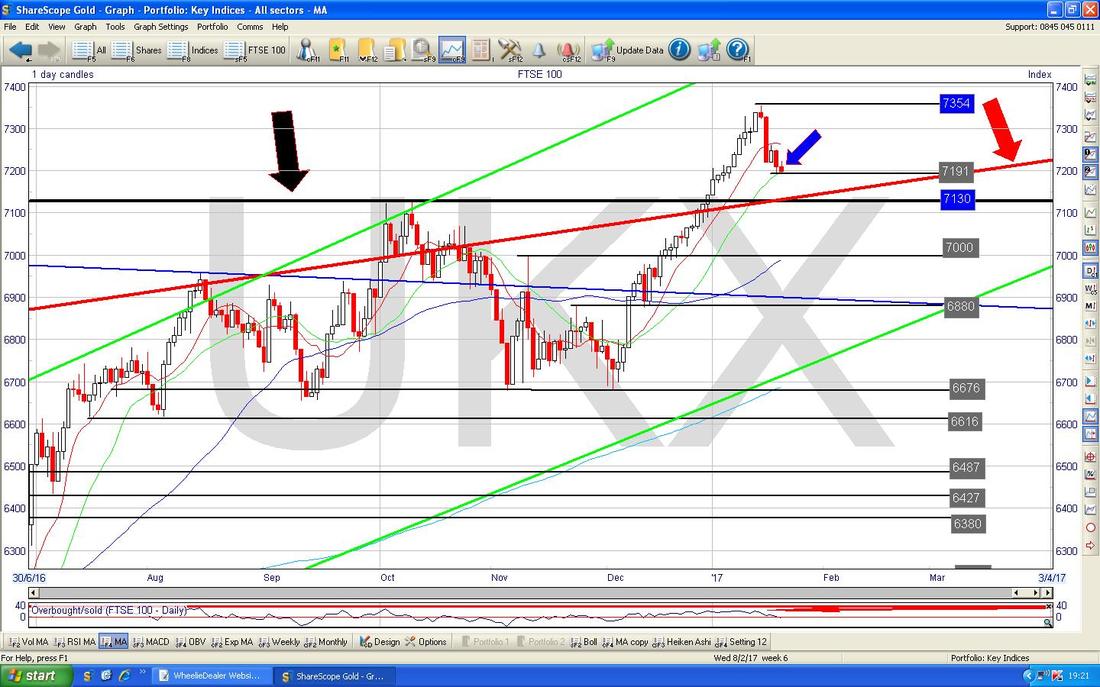
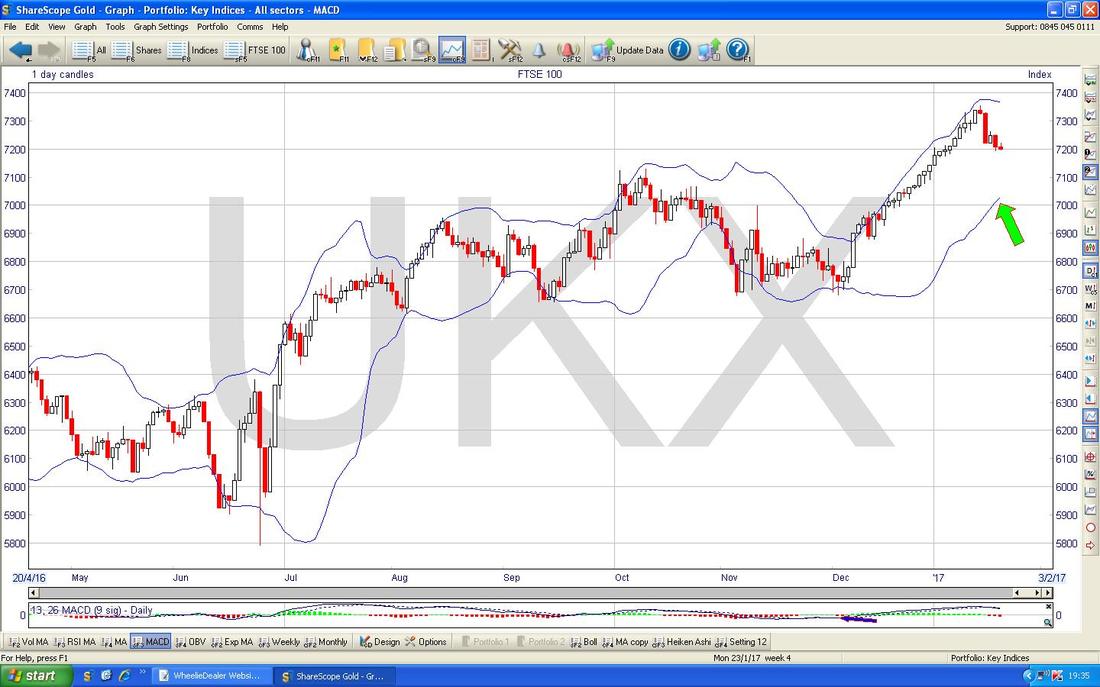
The Screen below has the Daily Candles for the FTSE100 Daily going back around 9 months. Around the Price Line, above and below, we have the Blue Wiggly Lines which are the Bollinger Bands - this is particularly interesting because it is consistent with the previous Charts in that it suggests Support will kick in at around 7000 - this is from the bottom BB and I have marked it with the Green Arrow.
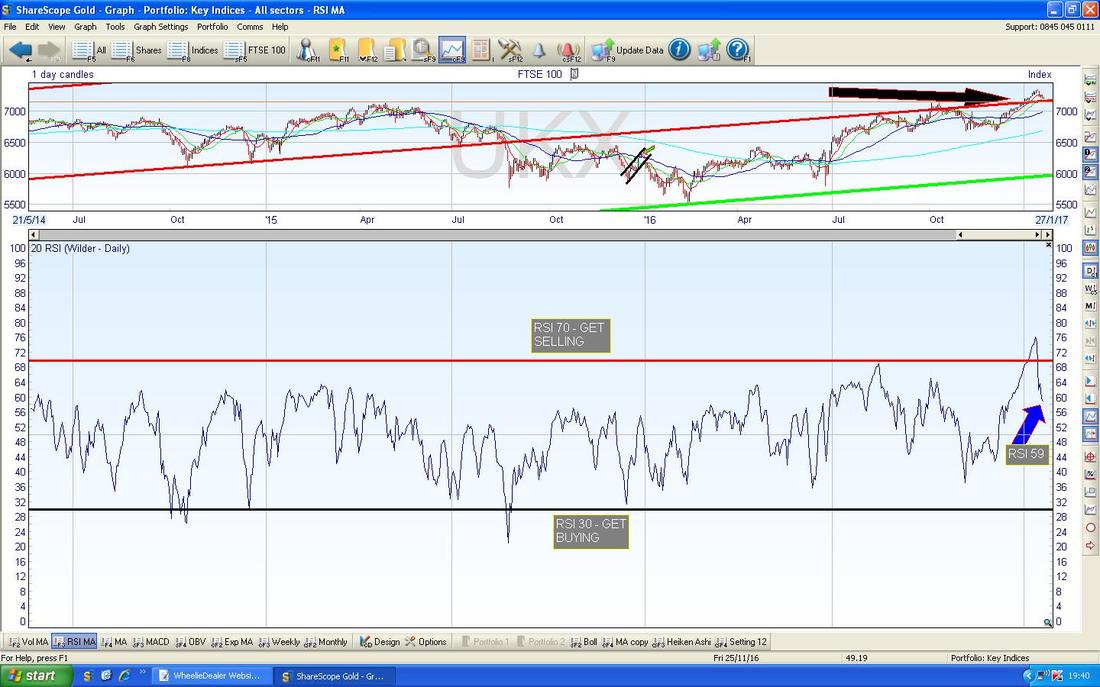
In the bottom window on the Screen below we have the RSI (Relative Strength Index) for the FTSE100 Daily. On a reading of RSI 59 this is still high and it is falling - if you look back to the left it is very unusual for the Price to rally around this kind of level - it normally falls a bit more before turning up.
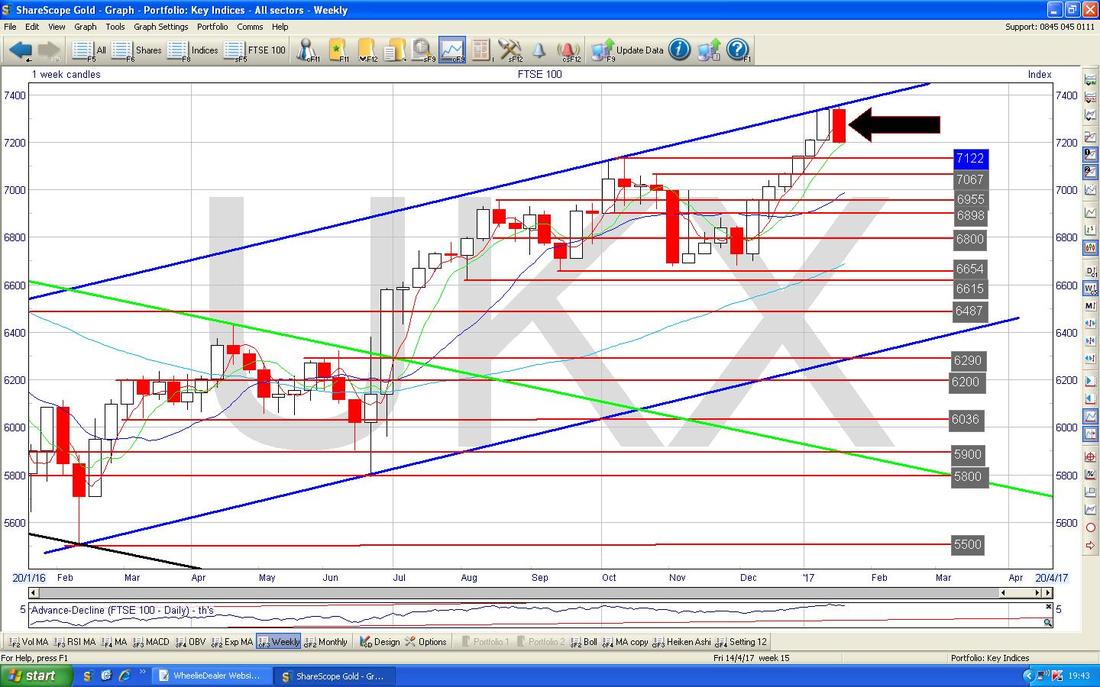
The Chart below has the Weekly Candles for the FTSE100. My Black Arrow points to a big Ugly Red Down Candle generated last week - this looks bearish.
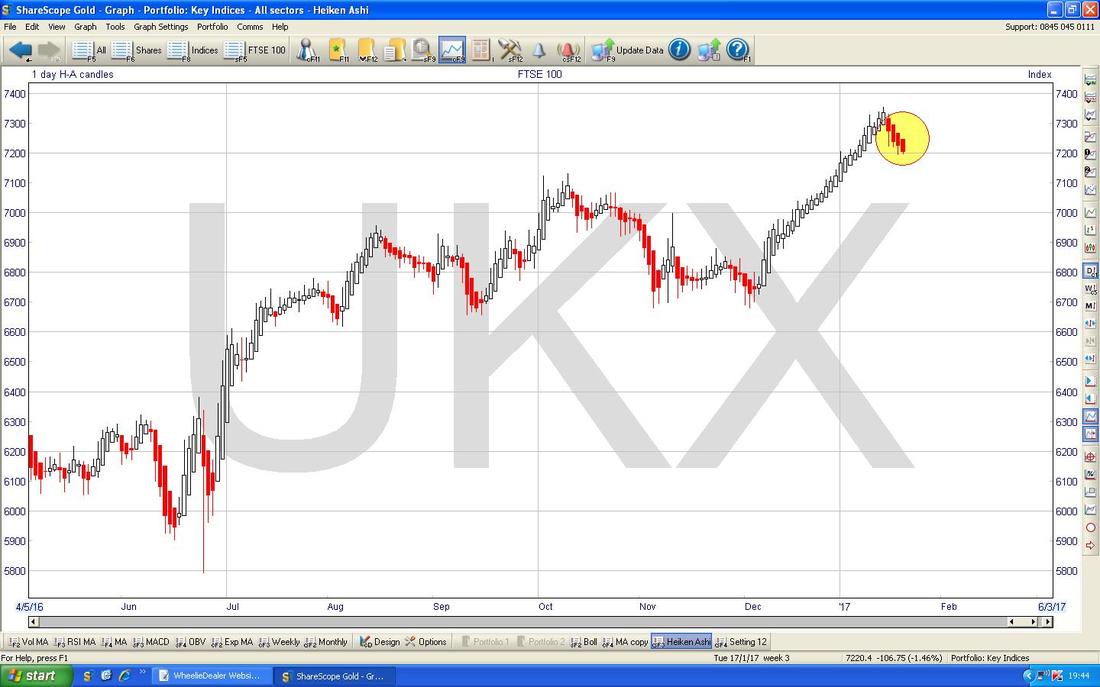
The Chart below has the Heiken Ashi Daily Candles for the FTSE100. My Yellow Circle is highlighting where the recent Candles have been clearly Red and suggesting Price falls and the last Candle is still pretty big and points to further falls before the current Pullback is exhausted. Again, this is all consistent with what other Charts have been telling us and I would expect the Price to test some of these Support Levels around 7000-7100.
CAC40, DAX30 (France and Germany)
I won’t dwell on these but something I spotted over the course of last week was how the CAC and the DAX were behaving quite differently from one another. This is very unusual as I find they tend to move in similar directions for a lot of the time - this obviously makes sense because they are both key members of the EU. The Chart below has the Daily Candles for the CAC going back about 6 months - my Yellow Circle is attempting to point out how the Price has been continually making new Lows over the last 6 Days or so and clearly there is a bit of a ‘Down Wave’ going on here. 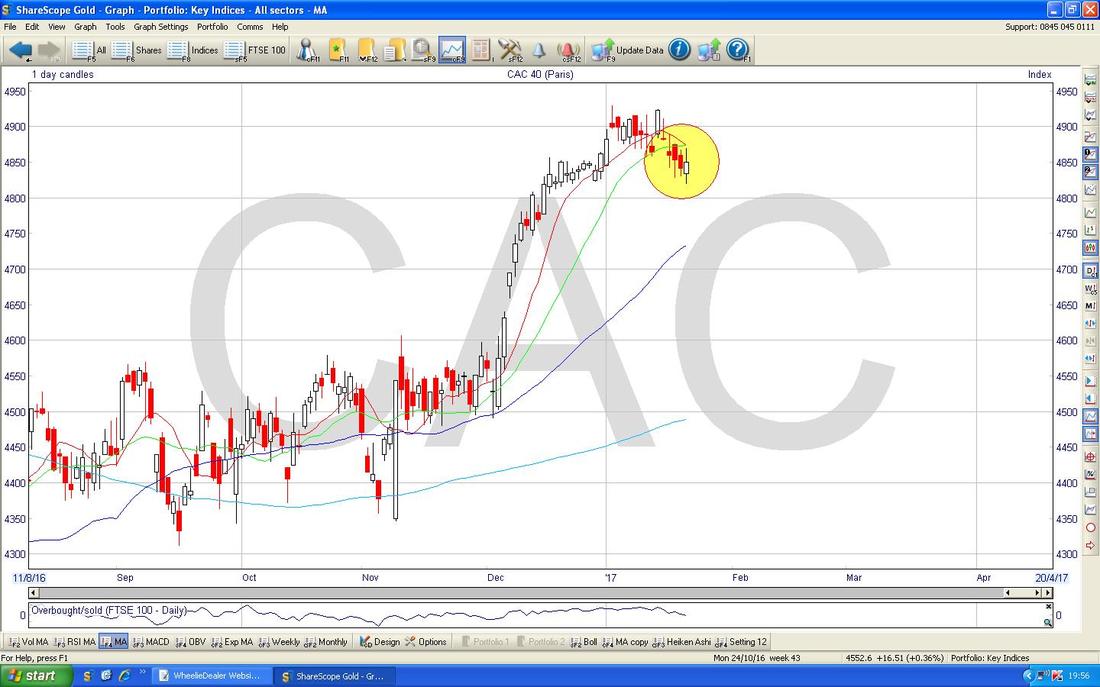
The Chart below has the Daily Candles for the DAX going back a similar time. My Yellow Circle highlights the last 7 Days or so and the thing to appreciate here is the divergence with the CAC which I showed above. While the CAC has been falling, the DAX has been going Sideways. On the DAX, the beauty of such Sideways movement is that when it finally Breaks-out of the Range (to the Upside or the Downside) this will tell us the Direction to come and we should Trade in the direction of the Breakout.

Dow Jones Industrials Index
This one is interesting because it is probably the most well known and well followed Index globally - and the key thing here is that we are very near the 20,000 All Time High level and a Breakout over this level would be an immensely Bullish Event. However, this Index only has 30 Mega-huge Companies so it is not brilliantly representative of anything. As per the Chart below of the Daily Candles on the DOW, in recent Days the Price has been falling in a similar fashion to the FTSE100 and there are a few areas of Support not far below. Firstly my Blue Arrow marks Support from the 50 Day Moving Average (the Darker Blue Wavy Line) at around 19500 and after this there is a lot of Support from the Area in my Yellow Circle around 19000-19300. If the World heads off to Hell in the proverbial Handcart (whatever that is - is it a pram?), then there is very Strong Support down below at 18668 which comes from the previous All Time High Breakout Line in Red and marked by my Red Arrow. 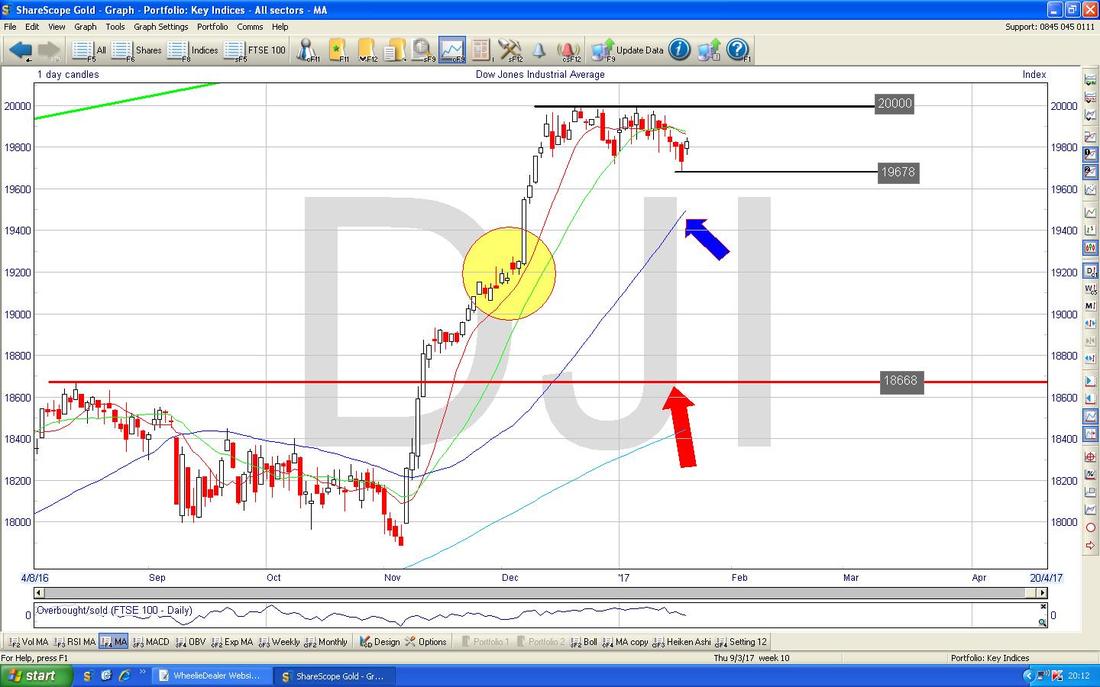
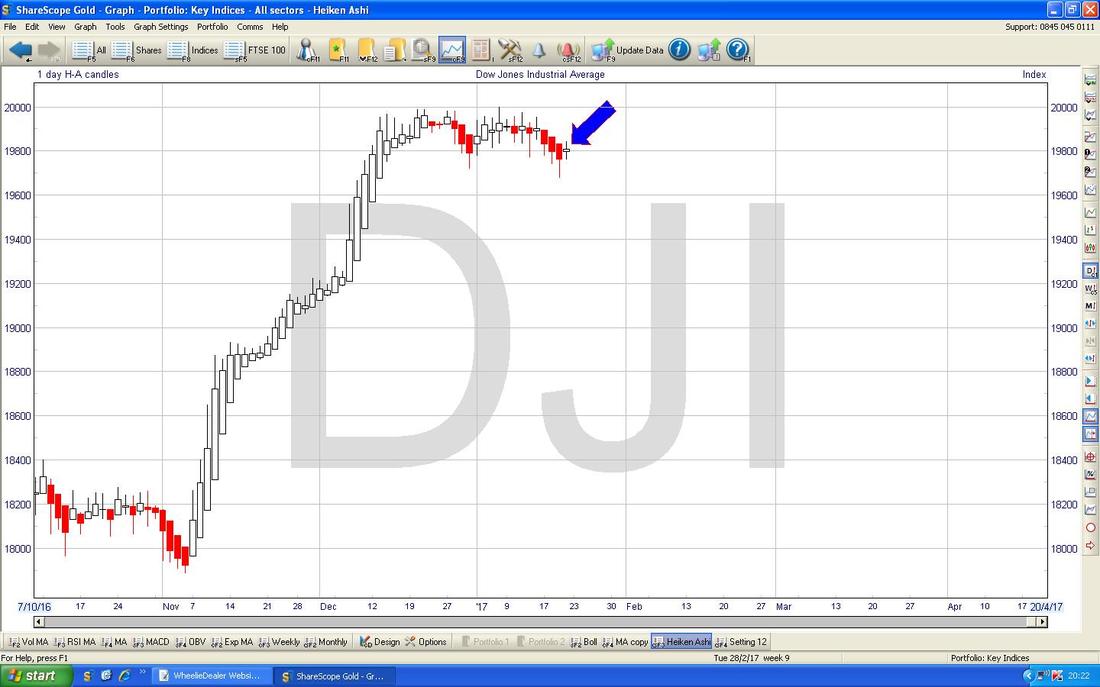
The Chart below has the Heiken Ashi Candles for the DOW. My Blue Arrow is pointing to a Small White ‘Doji’ type of Candle which was created on Friday - after the Red Down Candles of the previous 3 Days, this suggests that the Falls might be ending already.
FTSE250
There’s a few interesting things here which suggest the FTSE250 could be weak for a bit - this is useful to know for myself because I have a fair bit of exposure to the FTSE250 (these are the next 250 largest Companies on the London Stock Exchange after the biggies in the FTSE100). The Chart below has the Daily Candles for the FTSE250 going back about 5 months. My Blue Arrow is pointing to a Down Candle from Friday which looks bearish and there is clearly a fair bit of Resistance up above at 18300 and 18607 which will be difficult to get over at first attempts. Down below there is Support from the 50 Day MA at about 17850 (Darker Blue Wavy Line) and a wide area of Support from about 17400 to 17800. 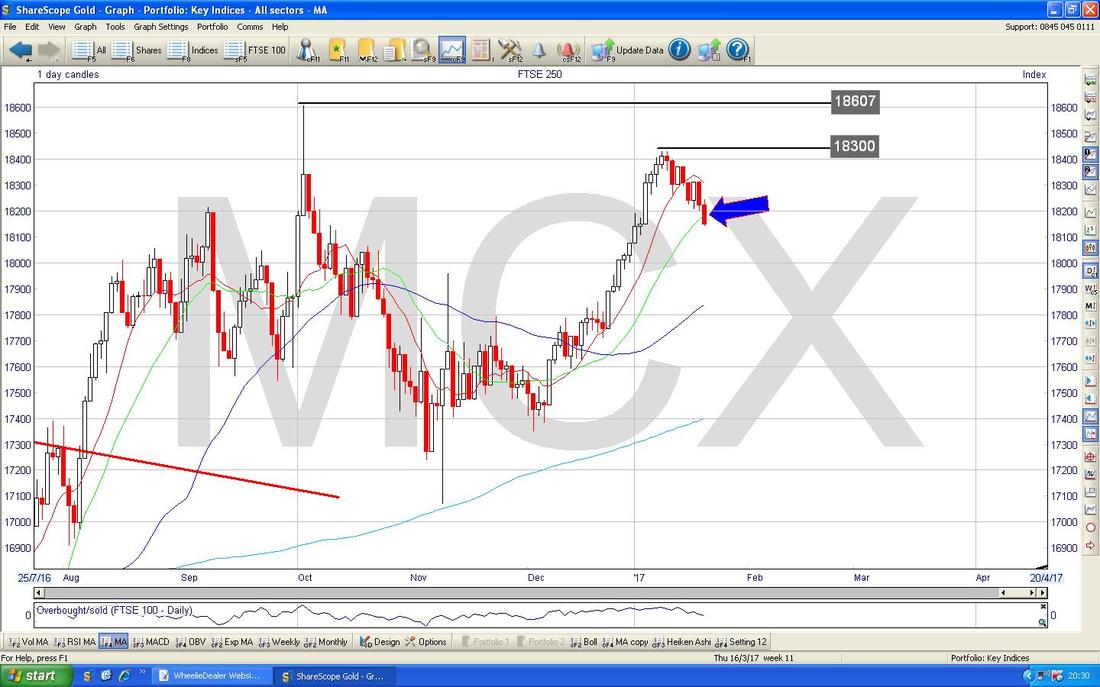
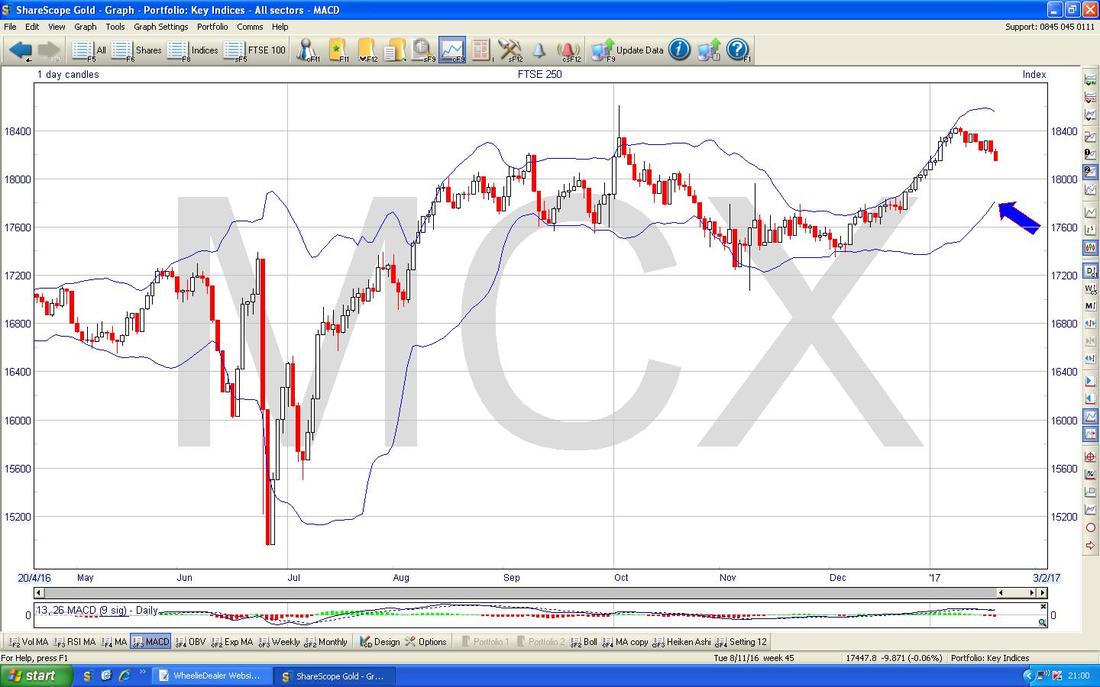
The Chart below has the Daily Candles for the FTSE250 with the Bollinger Bands above and below. My Blue Arrow points to the bottom Bollie Band around 17800 and this should act as Support.
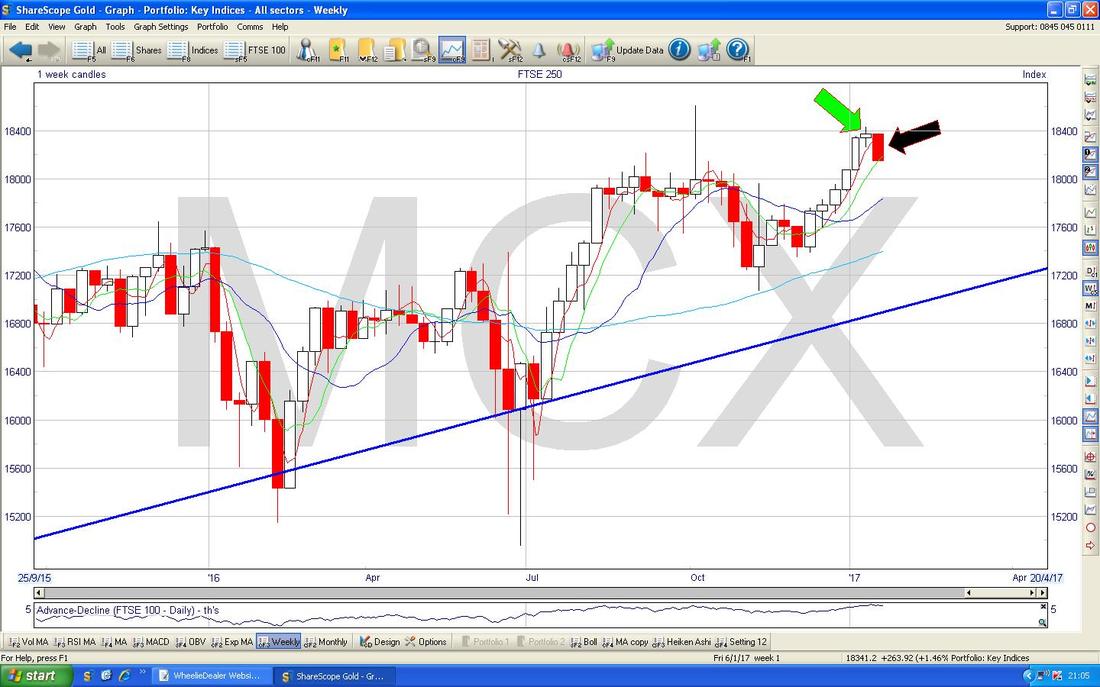
The Chart below has the Weekly Candles for the FTSE250. My Black Arrow is pointing to a Big Red Down Candle which was created last Week and this is particularly powerful because it clearly is a swing down from the Doji Candle from the Week before which I have pointed at with the Green Arrow. This suggests more falls.
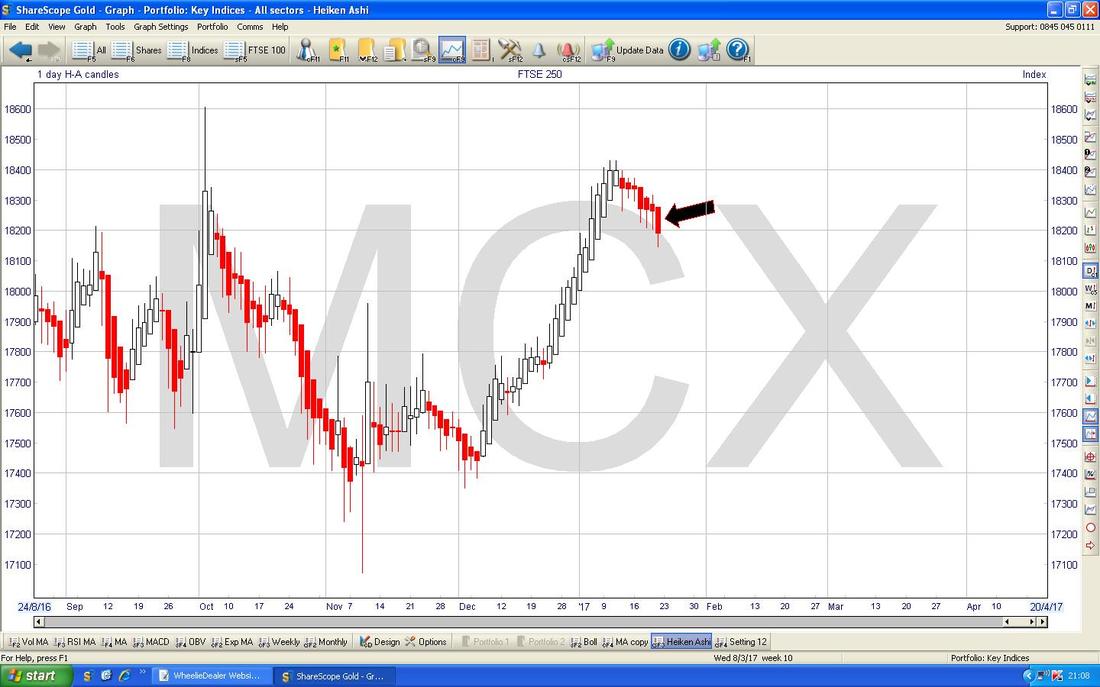
The Daily Heiken Ashi Candles which are shown on the Chart below have clearly turned colour into the Red Down mode and my Black Arrow is pointing to a Bearish looking Big Down Candle with a ‘Tail’ pointing downwards.
Pound vs. Dollar
This is of course extremely important as the FTSE100 has tended to move inversely to the Quid in recent months. The Chart below has the Daily Candles going back about 5 months and the first thing to note is how the Price has broken up above the Red Downtrend Channel which is marked with my Red Arrows. My Green Arrow is pointing to an Up Candle which was created on Friday and it is worth noting the Reversal that happened here during the Day - the Bears tried to take the Quid down but the Bulls came charging in and drove it back up again. Up above where the Price is now there is Resistance from the Blue Wavy 50 Day Moving Average Line at about 1.24 but the tone does look quite positive for a Stronger Pound here in the Short Term. If the Pound strengthens then the FTSE100 may fall. 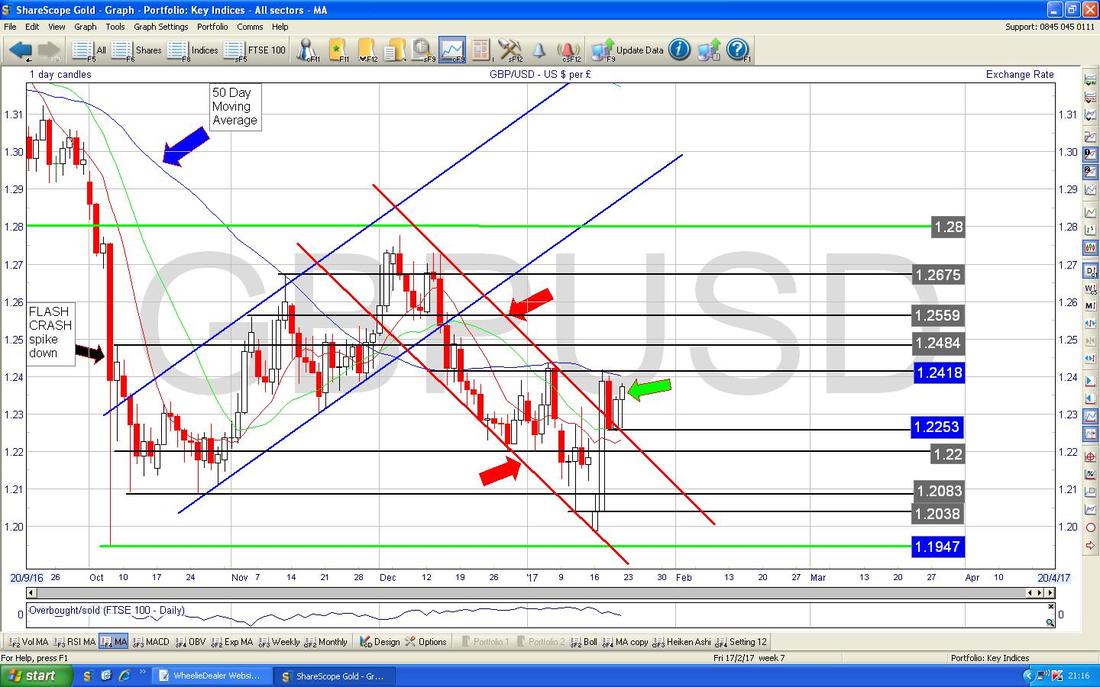
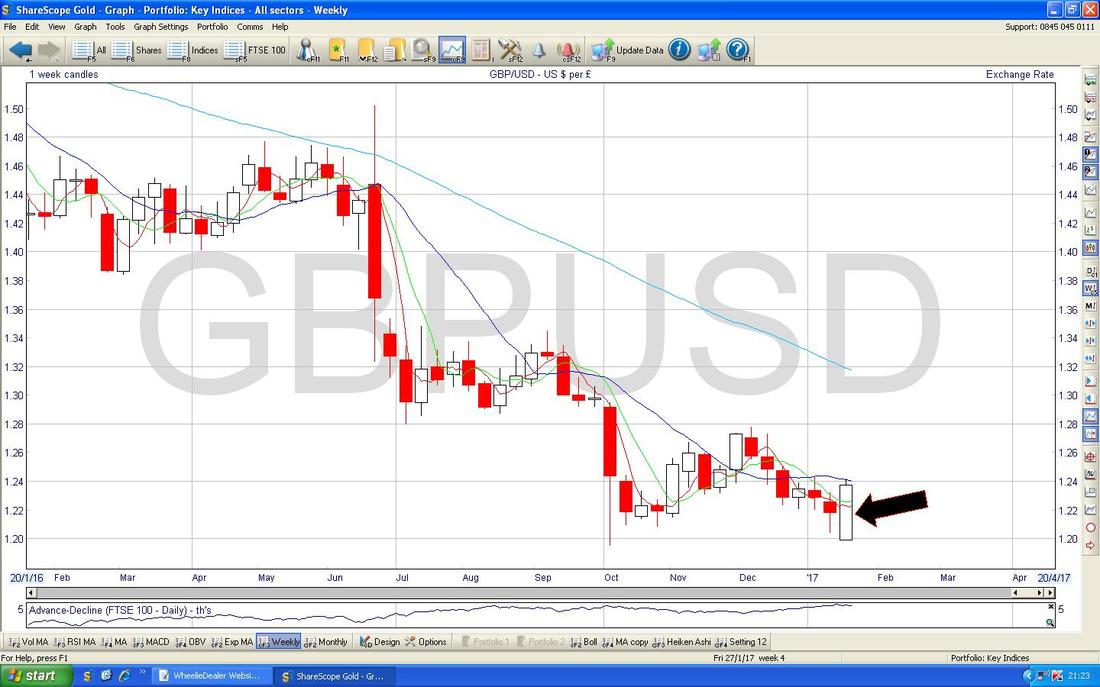
The Chart below has the Weekly Candles for the £/$. My Black Arrow is pointing to a Big White Up Candle and in the context of recent falls this is Bullish - a great example of a ‘Bullish Engulfing’ Candle because it engulfs the Small Doji Candle from the week before.
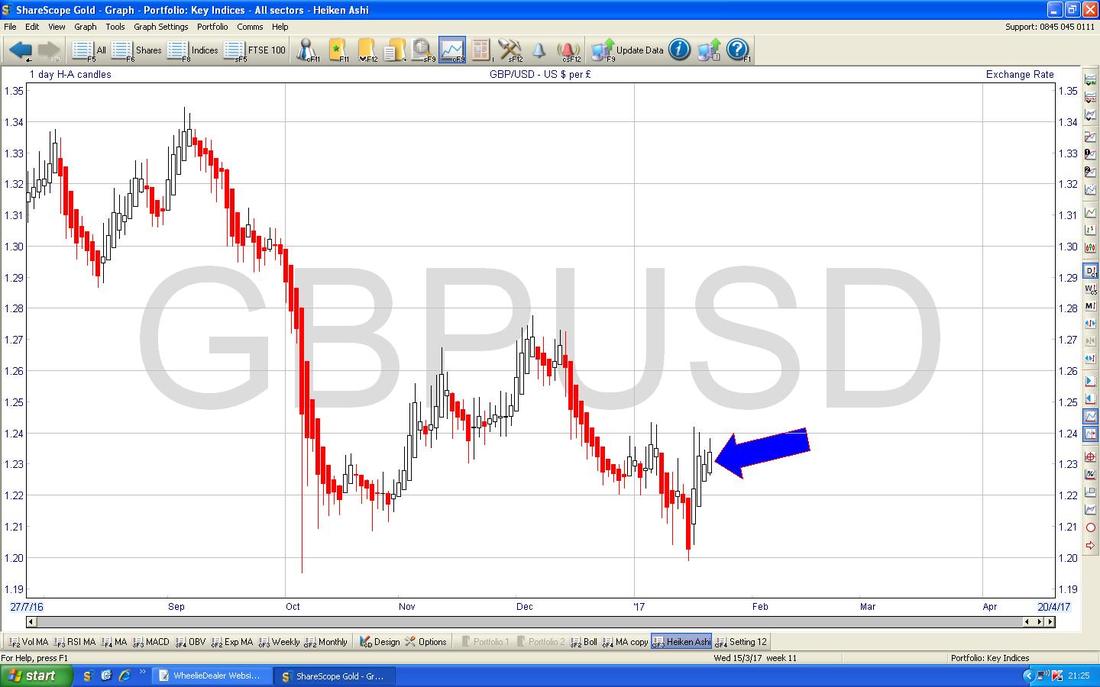
Below we have the Daily Heiken Ashi Candles for the Pound vs. Dollar. My Blue Arrow is pointing to a Bullish Candle which suggests more gains to come.
Nasdaq Composite
I won’t dwell on this one but the Chart below has the Weekly Candles for the Nasdaq Comp - the main US Tech Index. My Yellow Arrow is pointing to a classic ‘Doji’ Candle with a narrow body and it suggests that the power of the move up is weakening. A Doji like this does not necessarily mean a Reversal is about to happen although it can sometimes turn down off such a Candle. Usually you get a Doji like this towards the end of an Up Trend and it may be a few more Candles (in other words a few more weeks in this case) before a Reversal arrives. 
In the bottom window on the Chart below we have the MACD (Moving Average Convergence Divergence) for the Nasdaq Comp Daily. My Black Arrow is pointing to a Bearish MACD Cross in the Histogram Bar form and the Yellow Arrow shows the same Bearish piece of nastiness in the Signal Lines form.
NIKKEI 225
This is of course very ‘culturally appropriate’ because I am showing you the Heiken Ashi Candles. The Chart below has the HA Daily Candles and my Yellow Circle is highlighting how the Trend changed from Red Down Candles to White Up Candles - these suggest more gains to come. 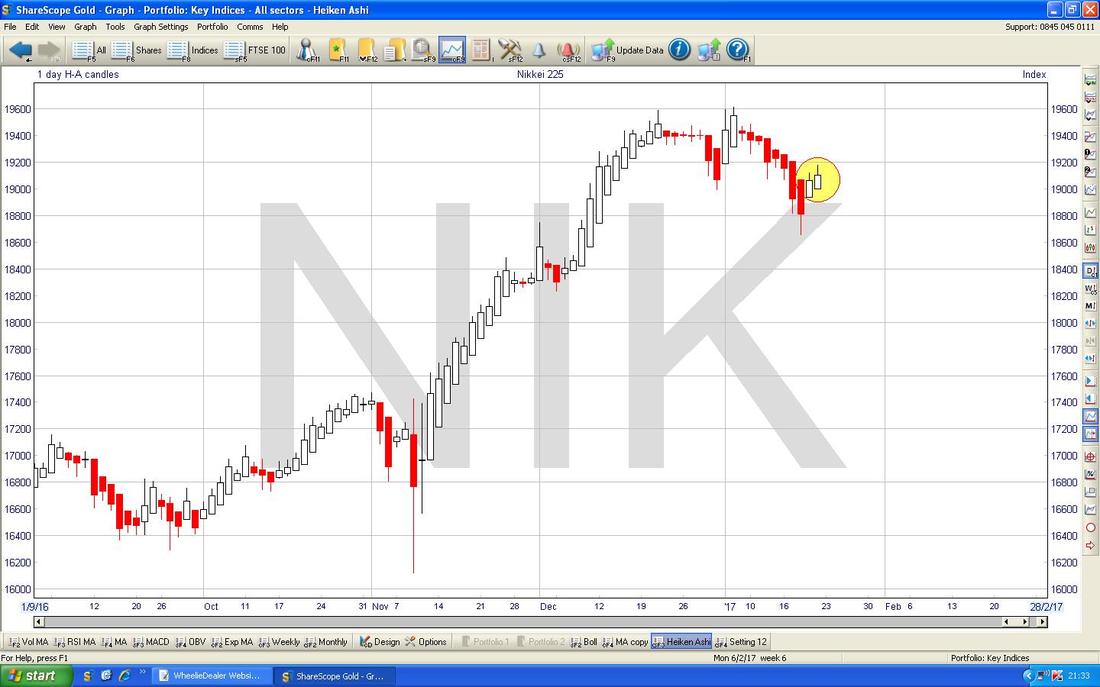
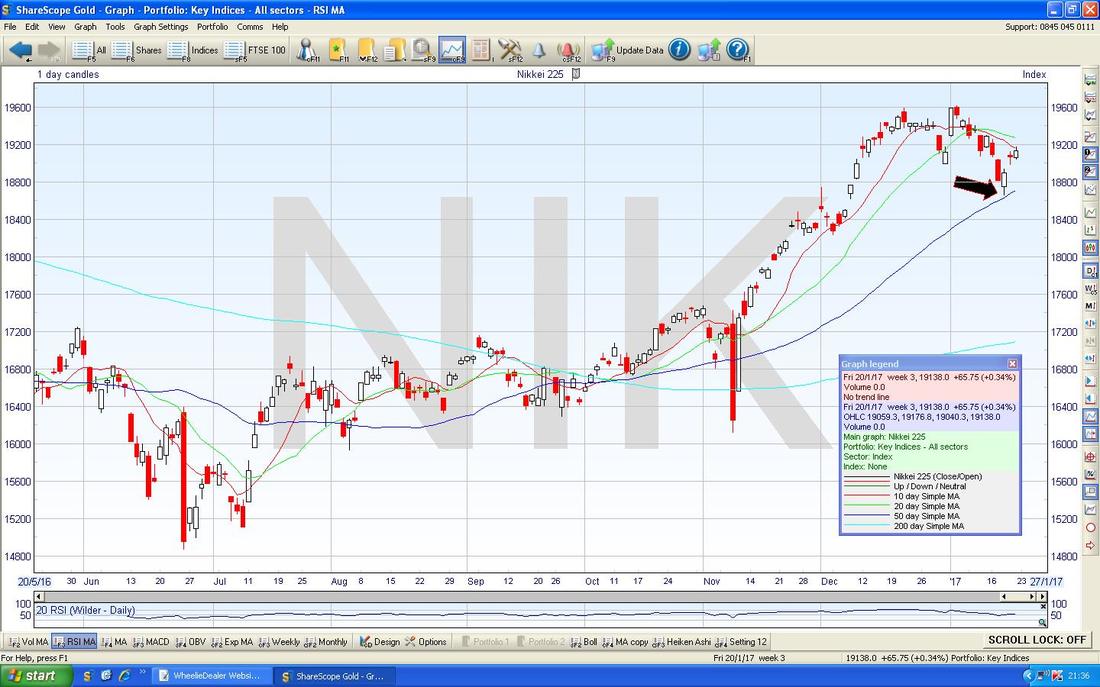
The Chart below has the Daily Candles for the NIKKEI 225 - My Black Arrow is pointing to where the Price fell down to the Blue Wavy 50 Day Moving Average Line and then turned up off this as the 50 Day MA acted as Support. This is all technically very pretty and lines up with what the Heiken Ashi Candles suggested above.
S&P500
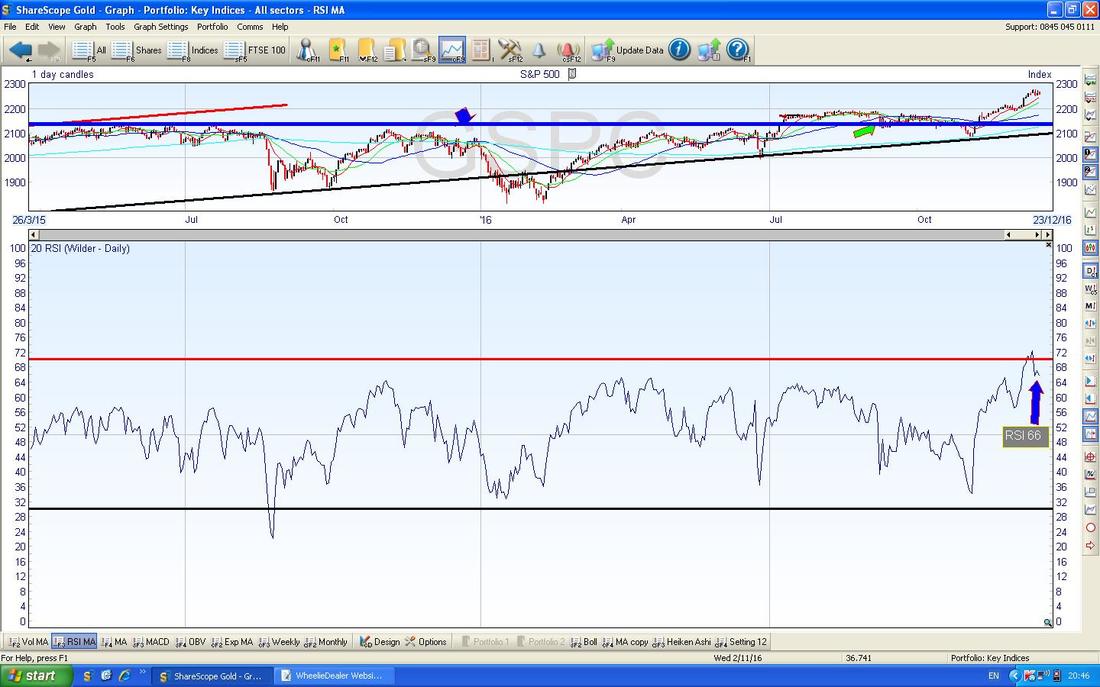
Here is just a quick chart on the S&P500 which in many ways is similar to the DOW. In the bottom window we have the RSI and in the top window we have the normal Daily Price Candles. The thing to notice here is the ‘Bearish RSI Divergence’ which is created between the 2 windows. In the upper window my Green Line from the last 4 weeks or so is horizontal but in the RSI line for the same time period, my Green Line is pointing Downwards - this is the Divergence and could mean a fall in the S&P500 is on the way. 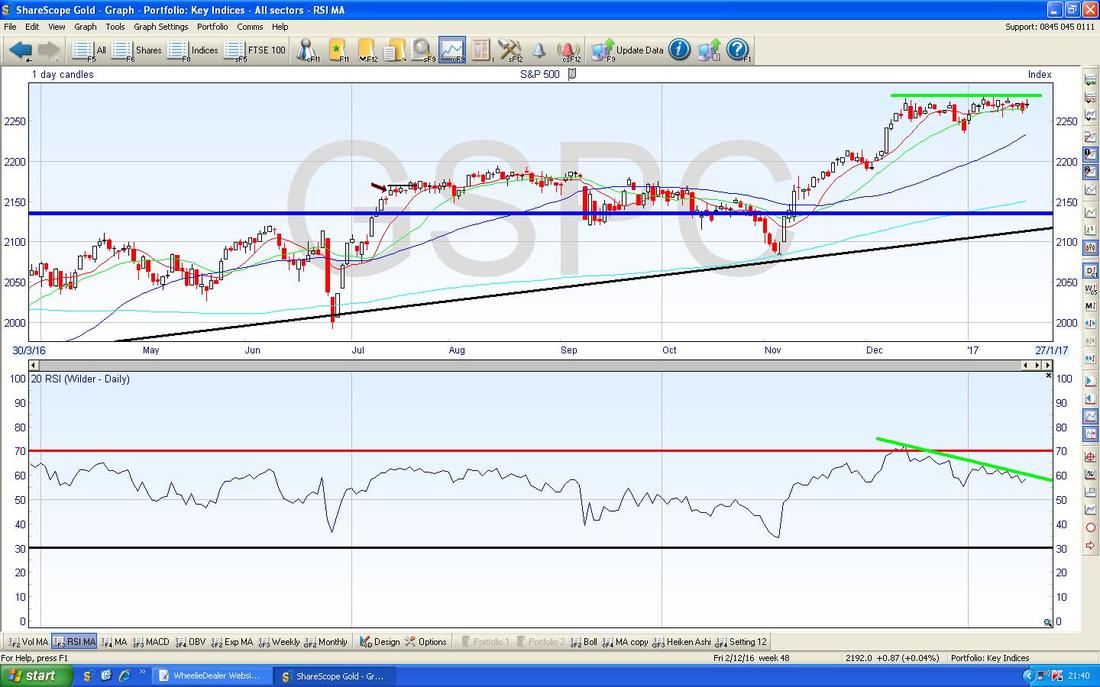
Brent Oil (Spot)
This is important because obviously it is a big driver of Oil related Stocks but also because a rising Oil Price may help the FTSE100 due to the weighting to big Oil Stocks. My Black Arrow points to a Big White Up Candle which was created on Friday and it is quite sweet how it has followed the Technical Analysis Textbooks and used the Previous Resistance at $54 to now be Support and move up from. Up above there is a fair bit of Resistance at $56, $57 and higher as shown on my Chart. $58.375 is the Key Level - if the Price can breakout over this then it should start to challenge $60 and up towards $70, but I suspect we are some way off this as yet. 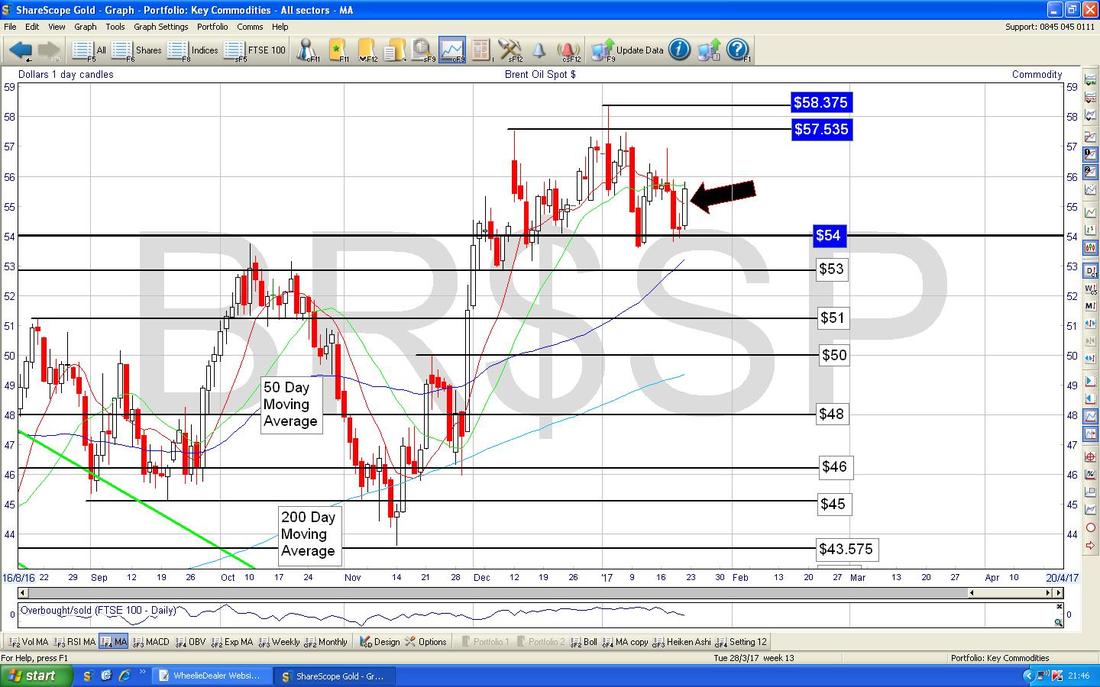
Gold (Spot)
The Chart below has the Daily Candles for Gold (Spot) going back about 3 months. My Yellow Circle is highlighting 2 Doji Candles which were produced on Thursday and Friday last week and suggest neither the Bulls nor the Bears are really in control here. In the Short Term this is all about Support and Resistance now. If Support at $1200 holds then I think we can go higher but if that Support fails then we will probably go back down and test the Lows at $1122 to £1140. If Resistance just above at $1220 can be broken over then we should see perhaps as high as $1265 before things calm down. 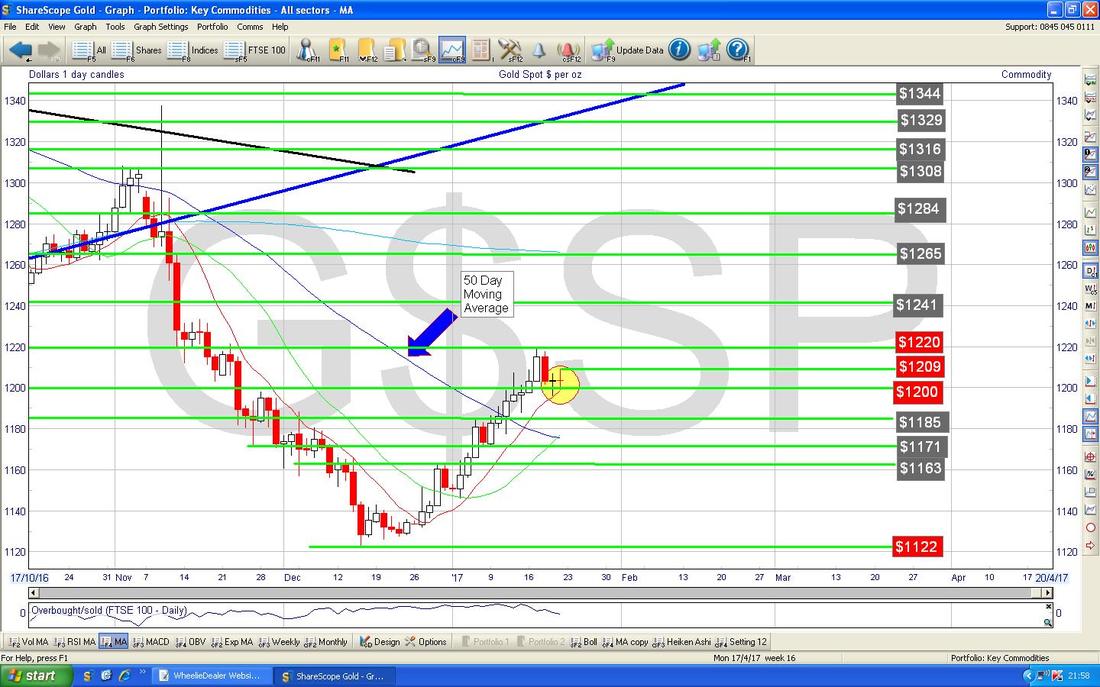
The Chart below has the Weekly Candles for Gold (Spot). My Yellow Circle is highlighting an ‘Inverted Hammer’ which after the run up from the 3 previous Weeks suggests a move down is on the way.
OK, that’s it for this week, I hope the Market Gods love ya next week !! Cheers, WD. 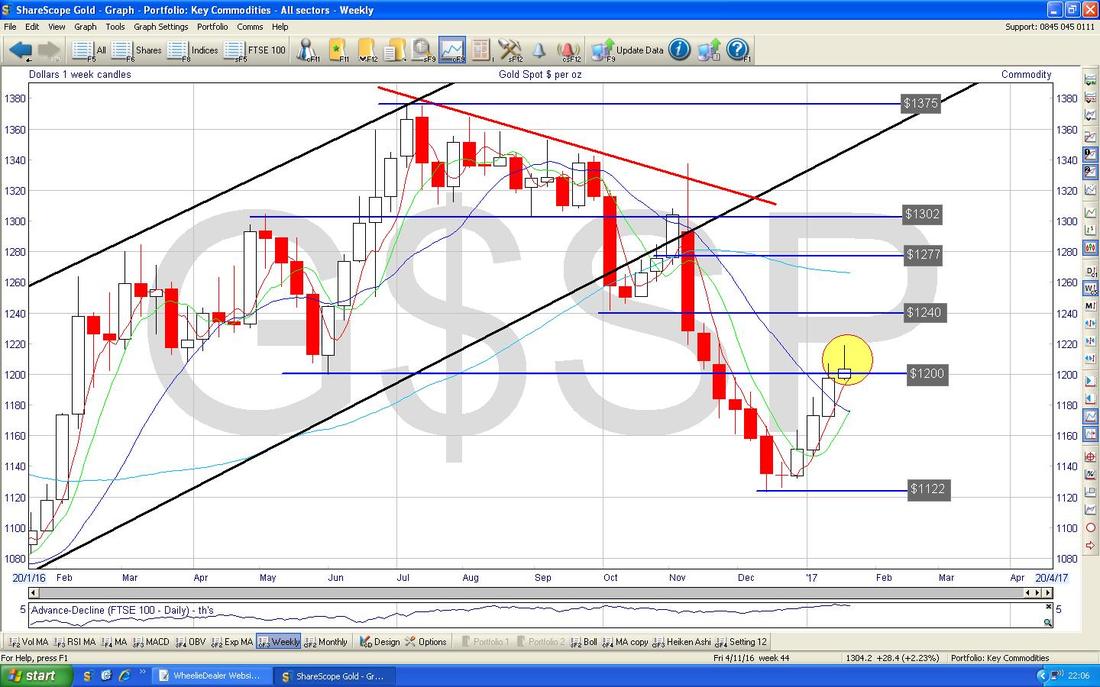
0 Comments
Leave a Reply. |
'Educational' WheelieBlogsWelcome to my Educational Blog Page - I have another 'Stocks & Markets' Blog Page which you can access via a Button on the top of the Homepage. Archives
January 2021
Categories
All
Please see the Full Range of Book Ideas in Wheelie's Bookshop.
|
