

|
educational blogs |
|
We’ve certainly had some pretty crazy weeks of late with the lead-up to the Brexit Vote and the fallout from the Result. As usual I will whizz through some Charts to get a feel of what the Indexes etc. are doing and look at the Historical backdrop.
I mentioned something on the Podcast I recorded with Justin earlier this week, and I felt it might be a good idea to just explore that a little more as part of this Blog (if you have not heard the Podcast there is a link at the Top of the Homepage which will take you to it).
The essence of my Comments were that towards the end of 2015 I was thinking that the Brexit Vote would be a Key Event during 2016 and I took the view that I did not fancy doing any bold moves on the Long side until this was out of the way. To this end, I have been pretty defensive all Year so far with copious amounts of Short FTSE100 Positions to try and insure against Downside Risk and I have not really traded much at all - in fact, some of the Trades I have done were of a Defensive Nature in that I was buying into GPM to play the Gold rallying theme.
I am pretty sure that in my ‘Xmas Message’ I did a Blog about my strategy for 2016 and no doubt I will have mentioned my reservations about 2016 and the Risks that the Brexit Vote would introduce. Anyway, the reason for these thoughts is that the Brexit Vote has now taken place - and although it could be said that the Outcome of the UK leaving the EU is not at all good for Stocks or the Economy, it might be possible to argue that a key piece of Uncertainty has now been removed and perhaps the Markets will like this. It is certainly the case that the FTSE100 did a very Bullish Breakout last week which I will show on the Charts in a bit, and the US Indexes are right up at All Time Highs - so Markets are perhaps surprisingly bullish. Of course, on the flipside we could say that the Uncertainty prior to the Brexit Vote has now been replaced by new Uncertainties around what Brexit means for the UK and European Economies and what sort of Trade Deals etc. the UK will end up with. In addition, we also have Uncertainty around who the Prime Minister of the UK is and Her Majesty’s Opposition is a total shambles. So Uncertainty is rife. It’s all a bit weird really - Markets seem miraculously Bullish when you consider all the Worries around the Macro Economic situation - I am not sure what to make of it. The simple fact is that the Charts are bullish and it makes me a bit uncomfortable holding my FTSE100 Short Positions - although luckily I managed to halve them back on Monday Evening. My hunch is that we will see some chopping around over the next few months and I am happy to run the Shorts and perhaps add to them if I get clear Sell Signals - the Autumn is nearly always a dodgy time for the Markets and I expect I will be able to unwind the rest of my Shorts around that time. Despite the Charts looking pretty bullish, I am not overly keen to take big Risks on the Long Side until we get past Autumn - I doubt I will be buying much in the coming Weeks but once September/October is out of the way, I might be keener to add to some Positions. We often get big drops in these Months so if this follows the normal pattern, then it could be a superb time to be buying. Historical Backdrop According to the UK Stockmarket Almanac 2016, for the coming week (W/C 4th July 2016), the FTSE100 is Up on average for 69% of Years and the average Return is 0.9% - so the History Books are on our side for a change !! For July, the History is good also with it being the 4th Strongest Month of the year. The Average Return for the FTSE100 is 1.0% with 56% of July’s tending to be Up. Something to note is that a typical July starts strongly and then has a couple of soggy weeks in the middle and then finishes with a Strong Week. FTSE100 I have no doubt that something very significant happened on the FTSE100 last week with regard to the Technical picture - we were treated to a ‘Breakout’ in a couple of ways which I will show on the Chart of the Weekly Candles below from ShareScope as usual. The really exciting Breakout was how the Price broke up through Horizontal Support at around 6500 - we had been in a Range from maybe 5900 to 6500 ish for almost a year and it looked possible that this was a Sideways move before making another move downwards. The fact we have broken to the Upside is very good news and makes the likelihood of a Bear Market pretty unlikely I think. This will surprise many people I suspect. We were also treated to a Breakout of the Green Sloping Downtrend Line that is clear on my Chart below - more confirmation of bullishness. My Blue Arrow is pointing to a Huge Up Candle which was produced last week - this is clearly a Bullish thing. We closed up around 6600 but I suspect things are a bit overdone in the very Short Term - this is consistent with the US Indexes which put in Inverted Hammers on Friday and suggests we need a pullback but I doubt it will be anything too serious. On the FTSE100, maybe we will pull back to that 6500 or maybe down to 6300 before turning up again - these would be good ‘Confirmations’ of the Breakouts. There is clearly Strong Resistance up above from 6600 through to the All Time High around 7100 - this will obviously be hard work to get over - but a Breakout over the All Time High would be immensely Bullish. 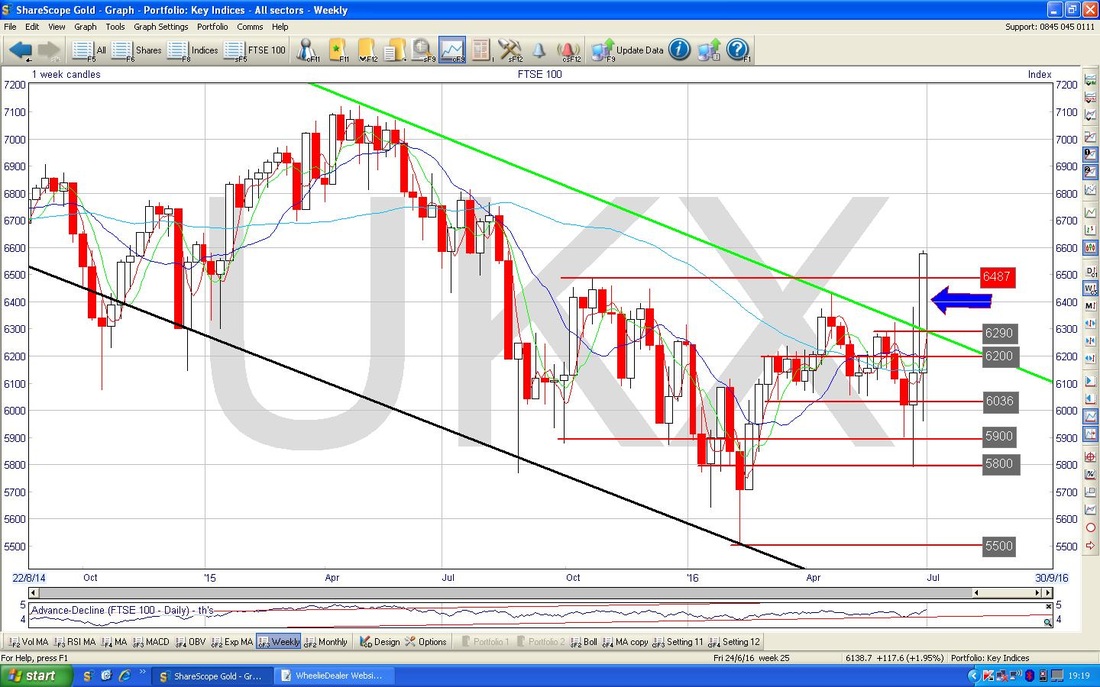
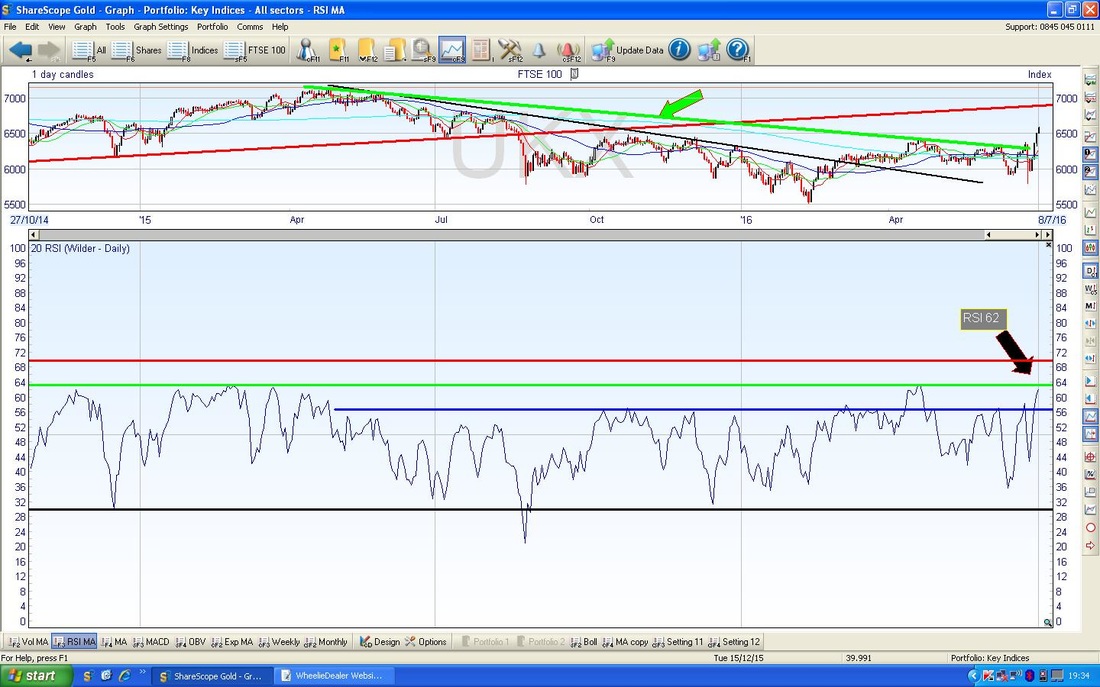
In the bottom window on the Chart below, we have the RSI (Relative Strength Index) for the FTSE100 Daily. Note we got above the Blue Line around RSI 56 which has been a Strong Resistance Level for the FTSE100 for most of the last year and a half and that we are now up against the Green Horizontal Line at RSI 64 ish. On a current reading of RSI 62 I suspect we are quite high now and ‘Overbought’ by the FTSE100’s usual standards. Generally speaking, for most things, RSI 70 is classed as Overbought but with the FTSE100 it rarely gets up to these dizzy heights. I would guess we need to ease back a bit in the Short Term.
The screen below has the Daily Candles for the FTSE100 inside the Bollinger Bands (the Blue Wiggly Lines below and above the Candles). My Green Arrow points to where the Price is now up above the Upper Bollinger Band - this is an unstable condition and usually the Price will fall back to be inside the Bands.

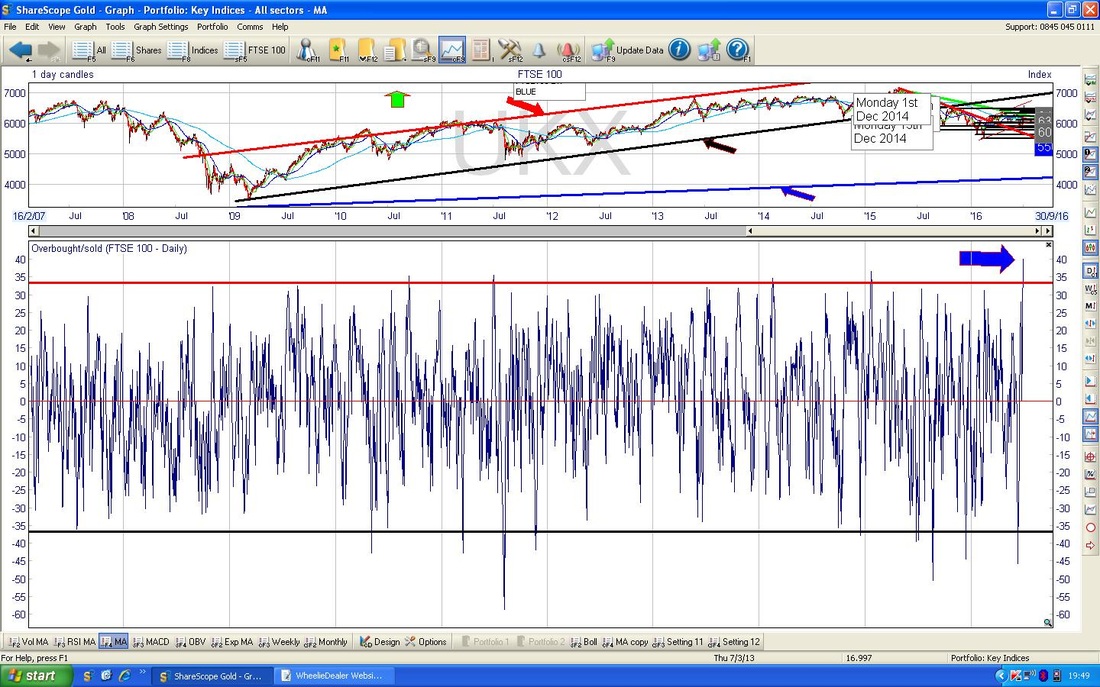
In the bottom window on the Screenshot below, we have the ‘Overbought/Oversold Indicator’ - this is an ‘Oscillator’ type of thing and is very much a Short Term Indicator. My Blue Arrow is pointing to where it is now - as you can see, this is by far the Highest Level for over 7 years or so - therefore I think we can be pretty sure this is very Overbought now.
FTSE250
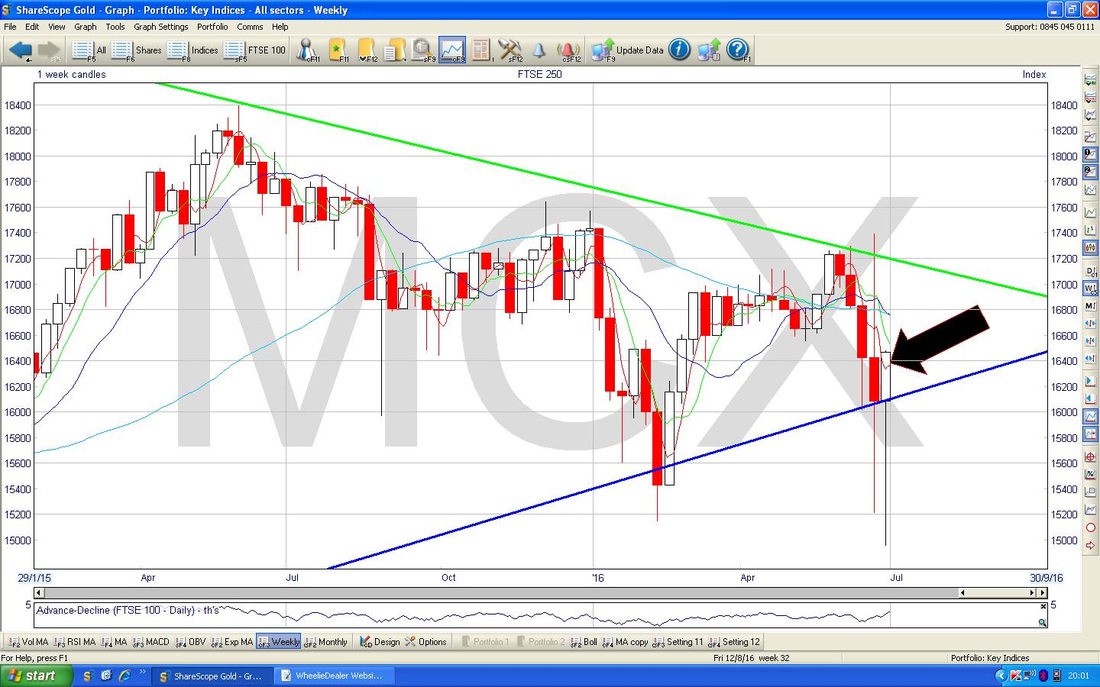
Seeing as there has been a lot of chat around regarding how the FTSE100 has shot up despite Brexit but the “more domestically focused” FTSE250 has lagged behind, I thought it would be useful to check out what the FTSE250 Charts were saying. Starting with the one below, we have the Weekly Candles for the FTSE250 going back for most of the Bull Market since 2008 ish. Note my Blue Uptrend Line which dominated for most of the time but this was breached to the Downside with the fuss over Brexit and obviously this is not such a great development. However, as we found with the FTSE100, if it can pull itself back within the Uptrend Line then maybe all is not lost. Note also the Green Downtrend Line I have put in - this might act as Resistance and cap gains for a while. 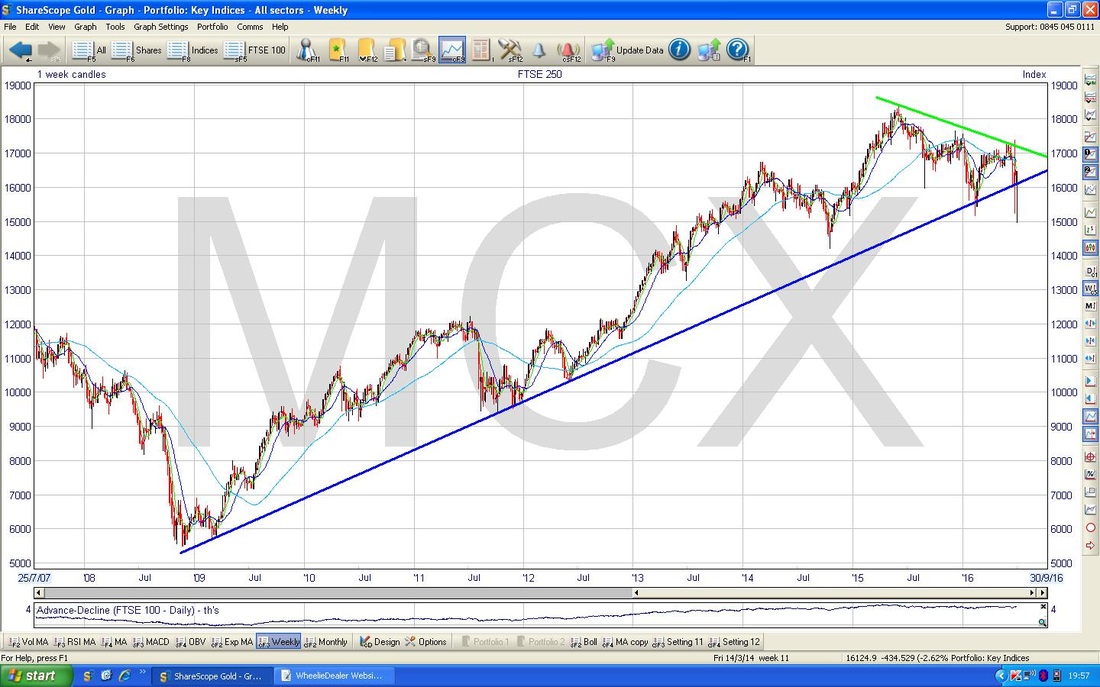
My Screen below shows the Weekly Candles for the FTSE250 - zoomed in to a bit over the last year. My Black Arrow points to a Hammer Candle which was created last week - in the context of 4 Down Weeks before, this suggests we will see a Reversal now and the Price will move up.
S&P500
My Chart below shows the Daily Candlesticks going back just a couple of Months for the S&P500 (the main US Index in my view). My Black Circle is surrounding an ‘Inverted Hammer’ Candle which was created on Friday - after 3 strong Up Days before, I would expect this Inverted Hammer to indicate the Price is likely to ease back a bit now. With the 4th of July Celebrations tomorrow, it is understandable why we couldn’t hold the Intraday Highs on Friday. 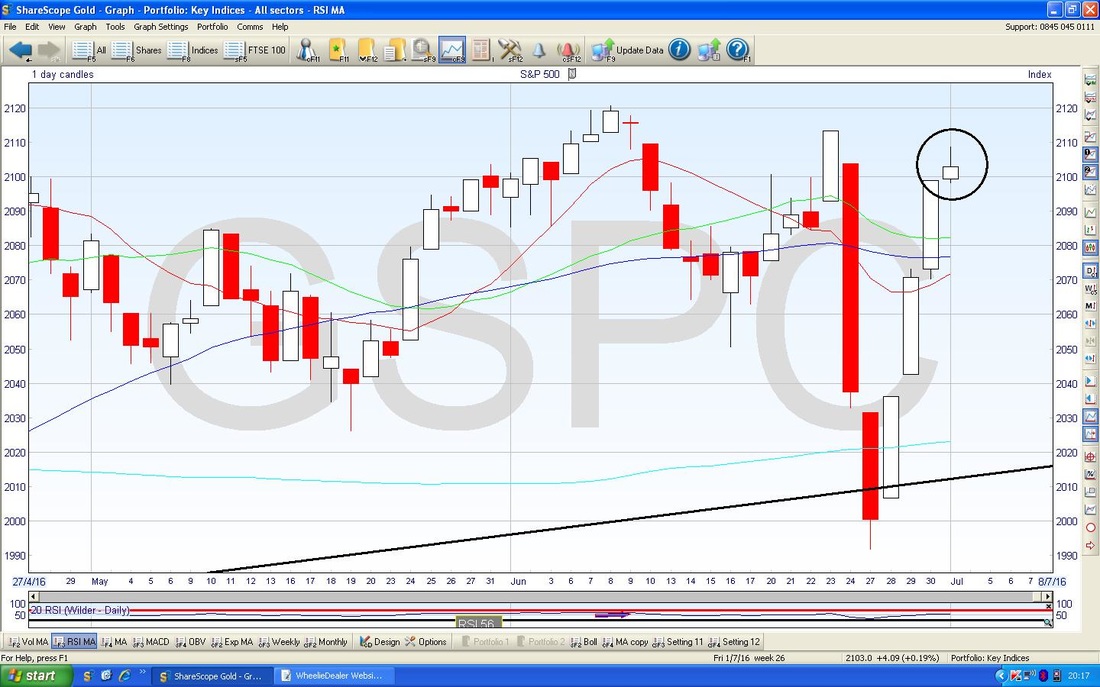
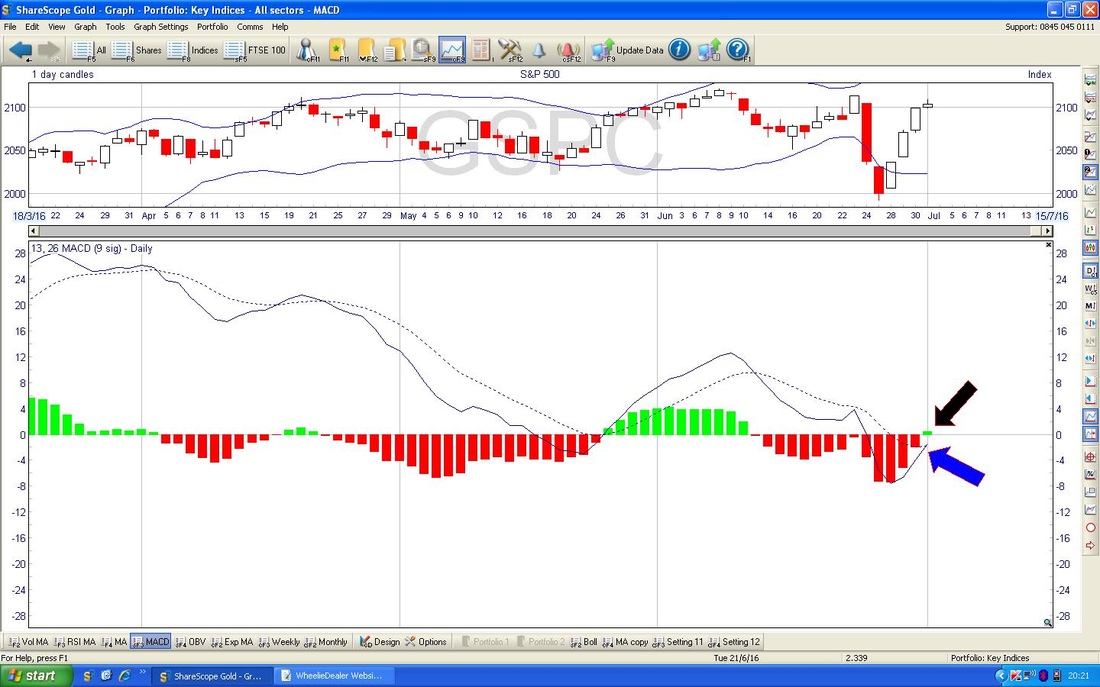
The bottom window below shows the MACD (Moving Average Convergence Divergence) for the S&P500 Daily. My Black Arrow is pointing to where the Histograms have moved from Red to Green which shows a Bullish MACD Cross. This is also shown with my Blue Arrow which is showing exactly the same thing but in terms of the ‘Signal Lines’.
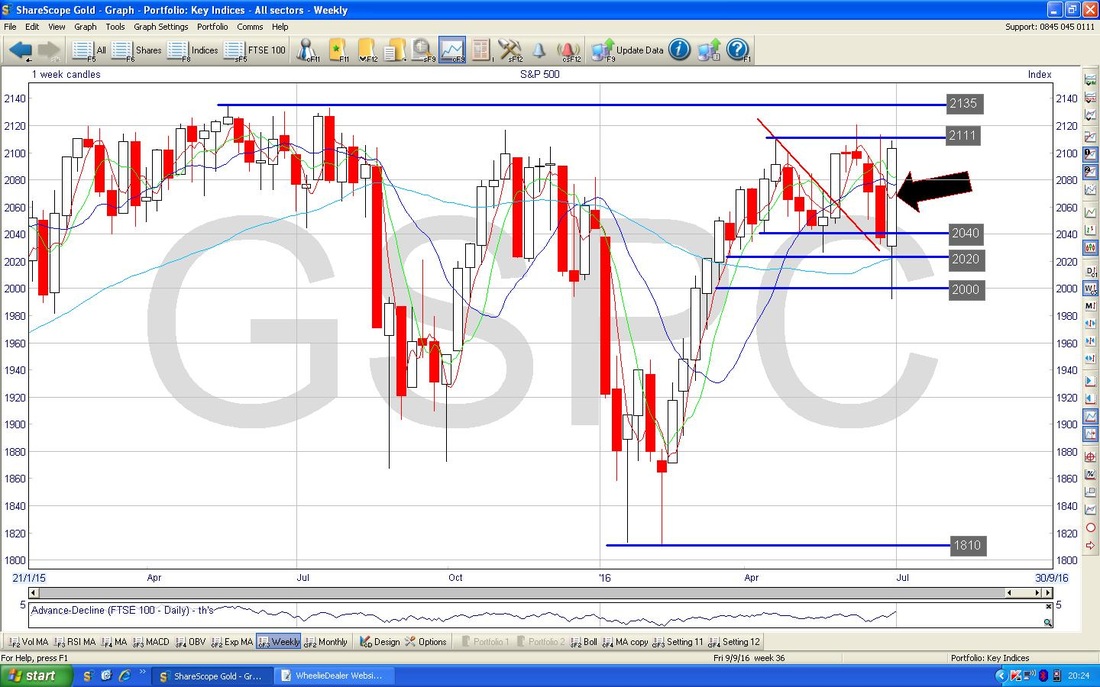
The Screen below has the Weekly Candles for the S&P500 - my Black Arrow points to a Big Up Candle which was created last week - this suggests some more Bullishness to come after 3 Down Weeks before. Clearly there is very Strong Resistance up around 2111, 2120 and the All Time High at 2135 - I suspect it will find things tough getting through the All Time High but it must be very possible. With the Inverted Hammer on the Daily Chart which I showed earlier, I would guess we will see a bit of a Short Term pullback and then we will start to move up again and have a go at the All Time Highs - a Breakout here would be amazing.
Brent Oil
The Screen below has the Daily Candles for Brent Oil going back about 9 months. Note we are outside the Blue Uptrend Channel lines but the Price is still above the 50 Day Moving Average and a sustained failure below this would hint at trouble ahead for the Oil Price. At the moment we are just above $50 and clearly we need a Break over $53 for Bulls to have some hope and Bears would want to see it Break down below $46 really. If the Price can crack $53 then $54 is next and this is likely to be a very strong Resistance Level. 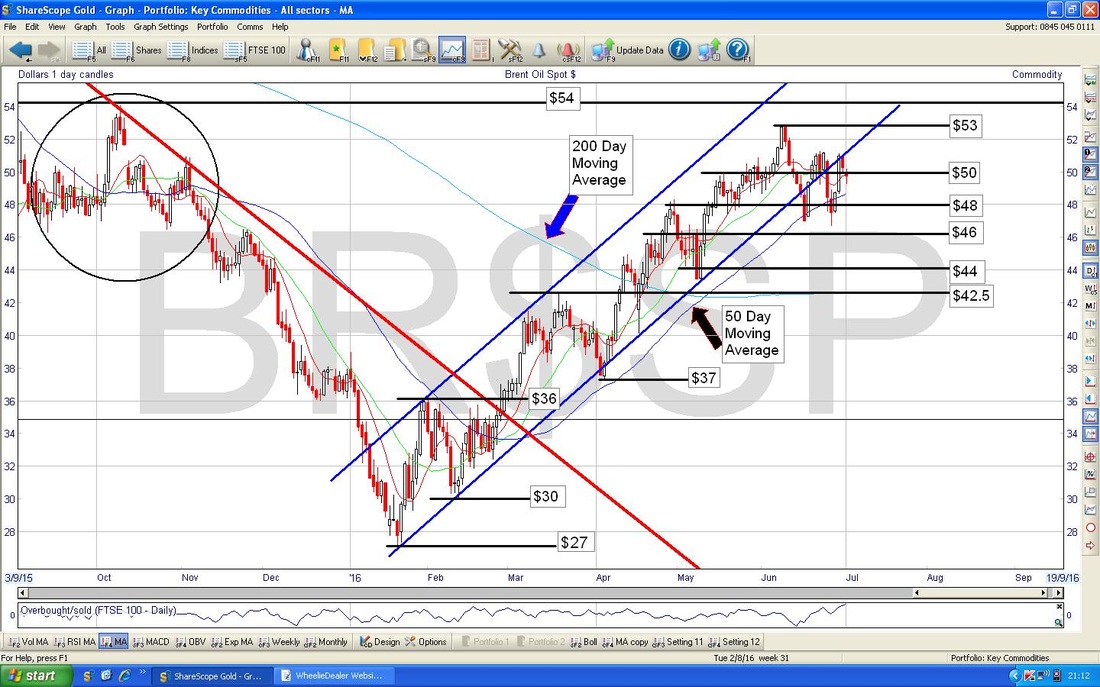
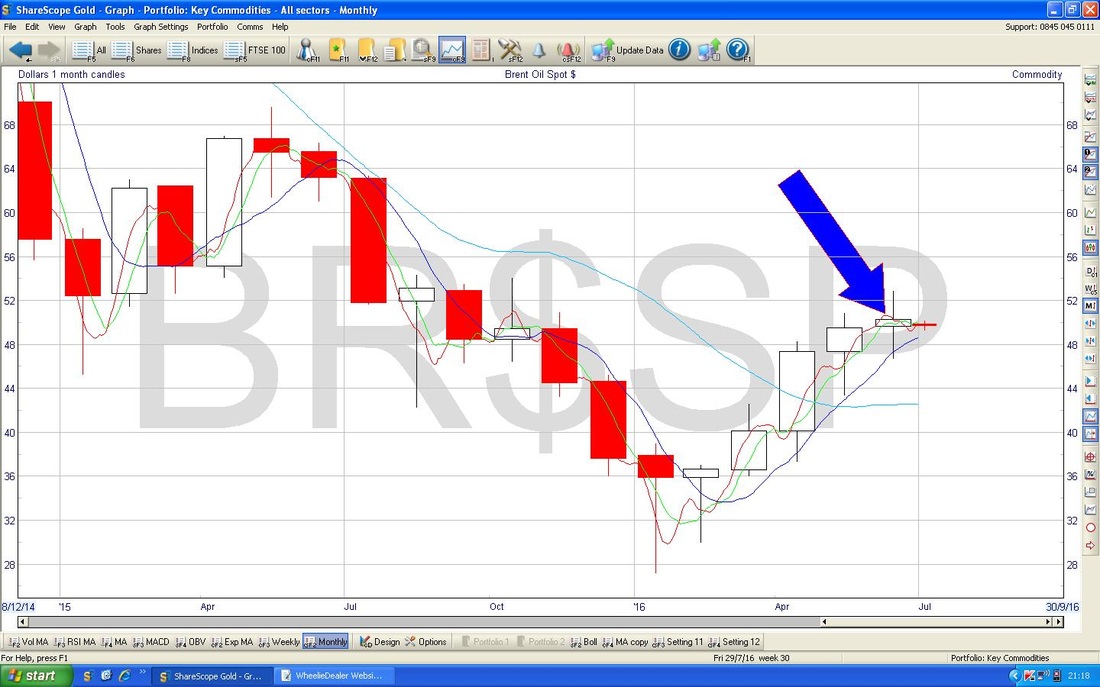
The Chart below has the Monthly Candles for Brent Oil going back to the start of 2015. My Blue Arrow is pointing to a very ‘clean’ Doji Candle which was created for the Month of June - in the context of 4 Up Months before, this Doji might mark a Reversal or at least if we do not Reverse in July, the Doji from June is telling us that the force of the Trend Up is weakening and we could see a Reversal in coming Months.
Gold
We have the Candles for Gold below, going back for most of this year. My Black Arrow is pointing to a nice White Up Candle which was created on Friday and in the context of a Strong move Up to $1360 earlier in the week which then pulled-back for about 4 days and then swung up again, this move looks pretty Bullish. Obviously the Key Level here to get up through is $1360 which I have marked with the Blue Box. My Red Box marks $1304 which is an important Support Level - this was formerly Resistance so it is textbook charting that it should now become a Support Level. 
With Gold having such good moves up lately, it is tempting to think that it might be getting Overbought in the Short Term. However, if you look at the Chart below in the bottom window, we have a reading of RSI 66 which although High by the standards of many Assets, for Gold you can see that it has regularly gone over RSI 70 to as much as RSI 80 over the last 5 years or so - in other words there is room to move up a bit more.
OK, that’s it for now - I hope everyone has a great week !! Regards, WD 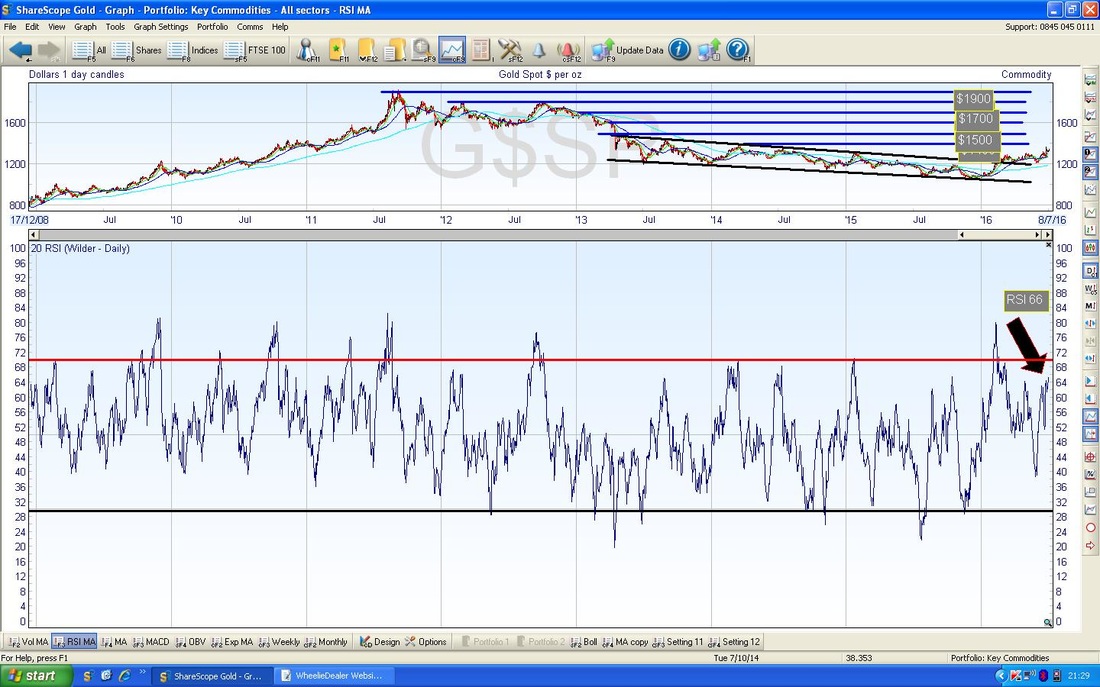
2 Comments
Daniel Victor
10/7/2016 10:27:53 pm
It's the Deutsche Bank situation that scares me !
WheelieDealer
16/7/2016 10:29:47 pm
Hi Daniel, you're right, that DB situation looks very iffy - and throw in the Italian Banks and it all looks pretty toxic. I'm sure I could have said the same thing for most of the last 7 years but I really get the sense that the Global Financial System is very precarious - the thing that really gets me befuddled and a bit terrified is this whole Bond Bubble - it just seems utterly insane to me and I even noticed that High Risk Corporate Bonds (not Junk Bonds) are only yielding 4% - this strikes me as huge risk for piddly return........... Leave a Reply. |
'Educational' WheelieBlogsWelcome to my Educational Blog Page - I have another 'Stocks & Markets' Blog Page which you can access via a Button on the top of the Homepage. Archives
January 2021
Categories
All
Please see the Full Range of Book Ideas in Wheelie's Bookshop.
|
