

|
educational blogs |
|
A good case could be made to say that this Blog will be a total waste of time and we cannot know anything before the Vote on Thursday 23rd June 2016, or, perhaps even more accurately, once we know the actual Result. I read something that said the Polling Results will start to come in overnight from various Regions and it looks like the Result should be known by the Open of the Markets on Friday 24th - I would guess that not all the Results will be in but the vast majority will be and the Market will react to this.
Historical Backdrop
Not that it will matter all that much with such profound Events later in the Week, according to the UK Stockmarket Almanac 2016, the Coming Week (w/c 20th June 2016) is Up for 41% of Years with an Average Return of MINUS 0.6% for the FTSE100 - so the Precedents are not pretty. I probably won’t need to remind Readers that June is historically the 2nd Worst Month of the Year and the last Week of June tends to be weak also. To slightly cheer everyone up, July tends to be a much better Month - but I will reveal more in a future WheelieBlog. Note “Sell in May and swan off somewhere until Autumn” has worked again this year so far - although the true measure of this is across the whole Summer period until St Ledger Day or Halloween which seems to be a better guide. Right, let’s check out some Piccies. FTSE100 I have tweeted a bit this week about The Big Picture for the FTSE100 and some signs that have caused me concern about where the Index is heading - I will do a couple of Charts to highlight my thinking and to make Readers aware of what could lie ahead. OK, from the wunderbar ShareScope Software as usual, I have shoved below a fairly Long Term Chart of the FTSE100 since the 2009 low point. Note the 2 Parallel Red Uptrend Channel Lines which if you remember got broken back in August 2015 to the Downside. It was important for Bulls that the FTSE100 Price got back inside this Channel and it failed to do so - in fact, I think the picture looks worse now as I will explain. Note how the Price has failed to even get back up to the Bottom Red Line of the Uptrend Channel which I have marked with the Red Arrow. My Blue Arrow points to where the FTSE100 tried very hard to move up and get back on a properly Bullish tack but just couldn’t manage it. 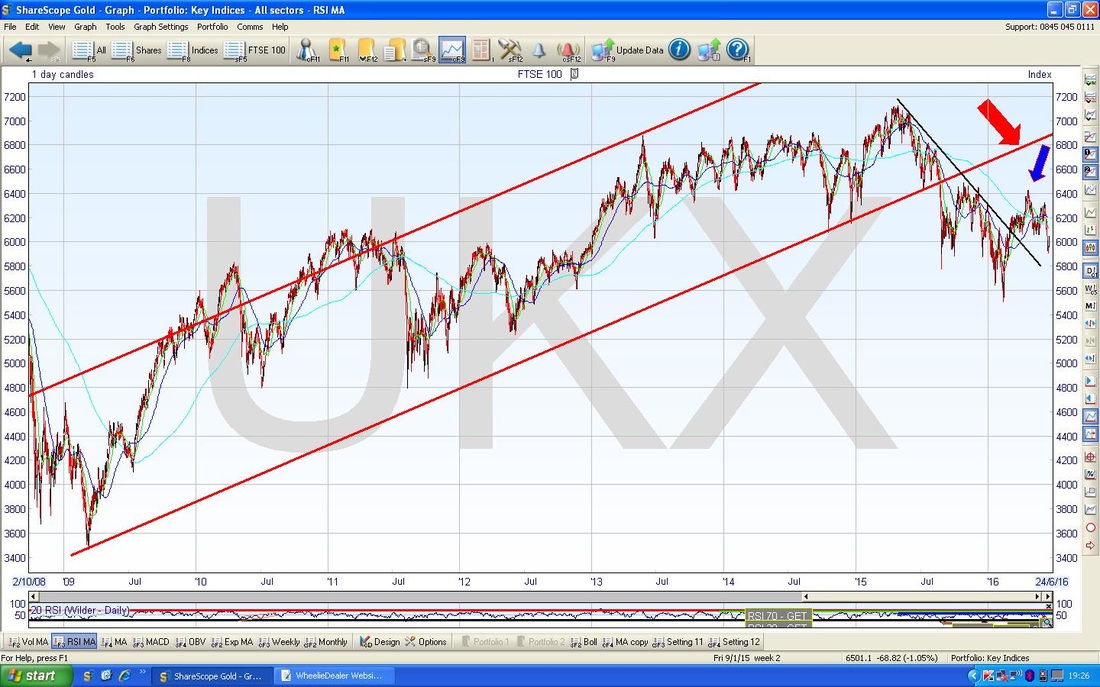
The Screen below has the FTSE100 zoomed in from the Chart above to about just over a year - I have left the Red Line and the Black Line that was on the last Chart but removed the Red and Blue Arrows. I have now drawn in a Green Downtrend Line which I have marked with the Green Arrow - this is the Line I have been tweetering about and this is the one that concerns me greatly - for things to get Bullish, we need this line to be Broken to the Upside - maybe a ‘Remain’ Vote later this week can kick it through - but that will need a move above 6300 which might be a big ask as there are plenty of other Negatives around at the moment even if the Brexit issue is resolved for the Status Quo.
Even if it can crack 6300, there is very strong Resistance at 6400 so it is very possible we could get an ‘Overshoot’ and appear to breakout but then fall back the following week or so. Friday’s are nearly always ‘funny’ days with low volumes and lots of choppiness - this Friday has the potential to be an extreme day by any standards. 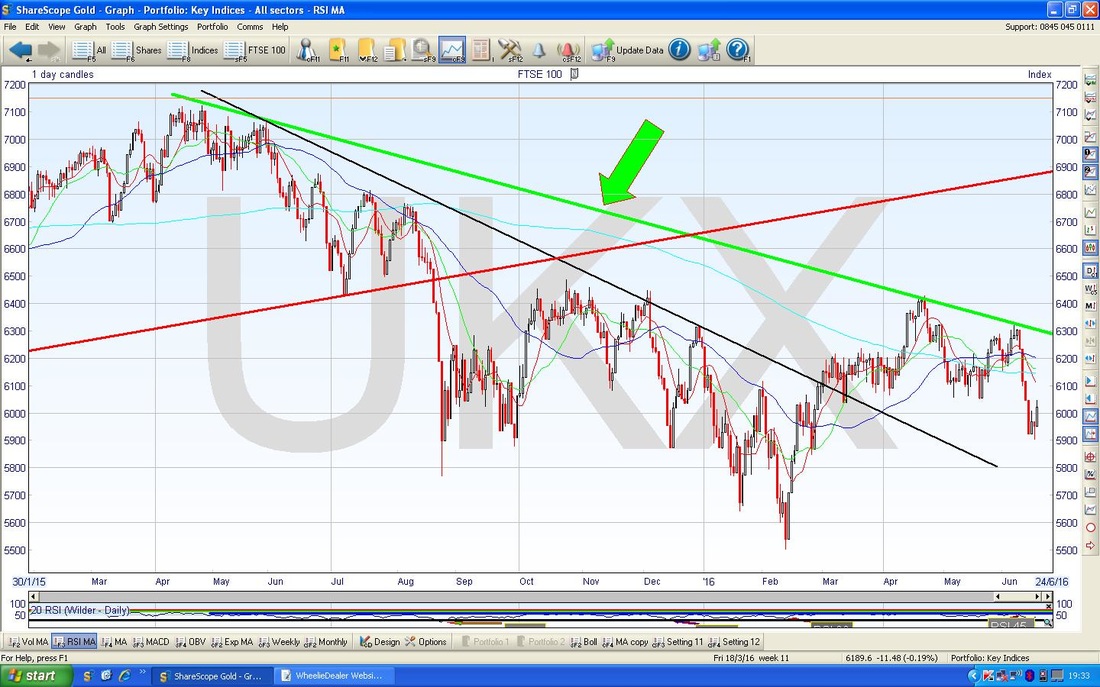
The Chart below drills in again to cover most of 2016 so far. I am aware this Chart is getting a bit ‘busy’ but I have tried to simplify it and I like the ‘Ladder’ of Support and Resistance Levels I have marked here and this is the exact Chart I am looking at myself for my Decisions - as ever, I like my Blogs etc. to be very much about ‘Investing in the Real World’ not academic bollox like you can see in elephantine proportions elsewhere.
My Red Arrow marks the Candlestick that was generated on Friday and not how it turned Up off the Red Hammer of the day before but also that the Close on Friday pulled back from the Intraday High - you can see this because the Candle ‘Body’ has a ‘Wick’ bit pointing up to stop around 6036 which was a Resistance Level from earlier. Note the 2 Levels I have put in Red Boxes - 6036 and 5900 (which was the Support Level from the bottom of the Hammer on Thursday). My thinking is that we might have a bit of a Range here for early in the week - although of course it is a very tight Range and we might find that 5900 fails to hold as Support - conversely, if there is some positive news for the ‘Remain’ Campaign in terms of Polling, then perhaps it will break over 6036 but with a negative backdrop from the US (which I will show in a bit) I doubt we will see much conviction to the Upside. I am expecting a ‘Buyers Strike’ where there will be plenty of people willing and eager to Sell out of Stocks but there will be a lack of Buyers unless Prices are very cheap - to understand this concept better, please see this WheelieBlog from the Archives: http://wheeliedealer.weebly.com/blog/why-do-share-prices-rise-and-fall I have seen a lot of scare stories and dreamt up Numbers by Analysts (talking their Employer’s Book no doubt) about how low FTSE100 will tank if the Voters go for leaving the EU - however, my view is that there are some strong Support Levels just below and I expect these will hold - if not, I’m thinking the worst we will see is about 5200 - but all of this is obviously guesswork. In particular, I expect the 5500 Level to hold - and it is possible we will bounce at 5639 if we get a Sell-off. As I mentioned earlier, to the Upside if there is a ‘Remain’ Vote, there is Strong Resistance at just over 6300 and 6400 and in addition the 6500 Level will be difficult to get through. My Blue Arrow points to something which could be a Medium Term concern - back in May we did a 50/200 Day Moving Average ‘Golden Cross’ but my Blue Arrow is pointing to the 50 Day MA which looks to be dipping down - if we get any weakness in the coming days/weeks, then it is very possible that we get a Bearish ‘Death Cross’ which would mean that we could have a few weak months to come - this is an important thing to watch out for. If we get a Bullish Jump up after the Vote, then maybe this negative scenario can be avoided. 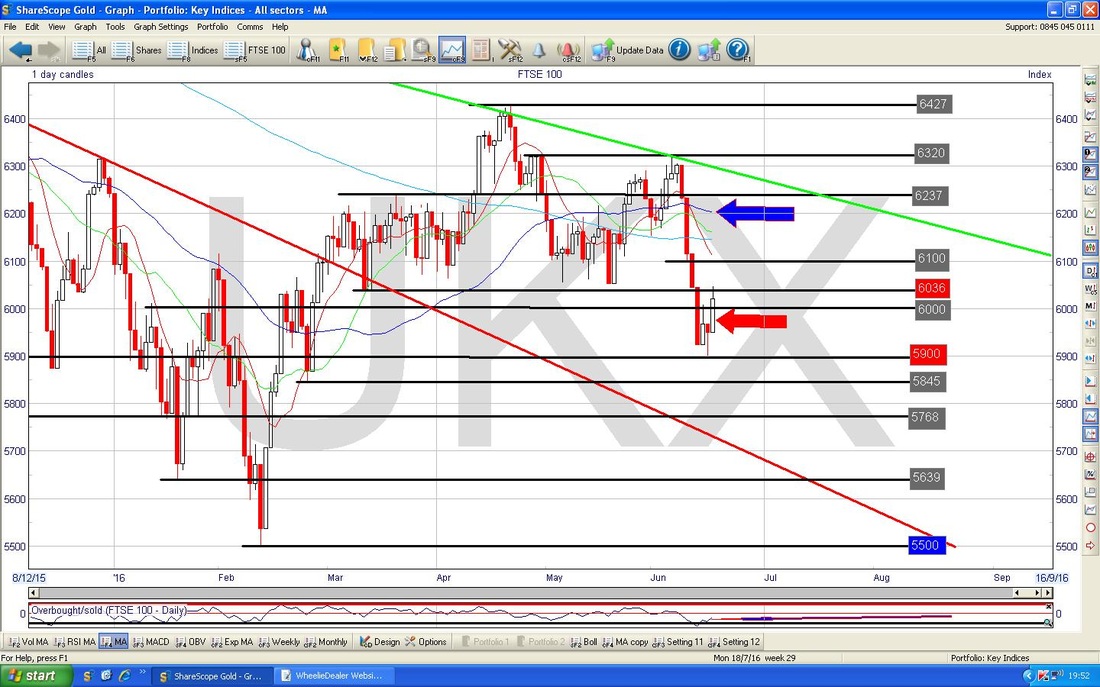
I find the Chart below intriguing - this shows the Bollinger Bands going back about a year nearly. What is interesting is that usually when the Candles go down to the Bottom Bollie Band they turn up and keep moving up to the Upper Band (they may not reach it but they usually head that way and get close). So this Chart on the face of it makes me think we will see more gains - my Yellow Circle is highlighting where we are now. However, with the big Events we know are due this week, it doesn’t really tie up - I will be very surprised if we get a strong rise - but of course that could happen.
Anyway, if you look to the left, there is a sort of Aqua/Turquoise Circle which shows where we had a very similar Setup but it didn’t move up to the Upper Line but actually fell again - so that pattern could be repeated. 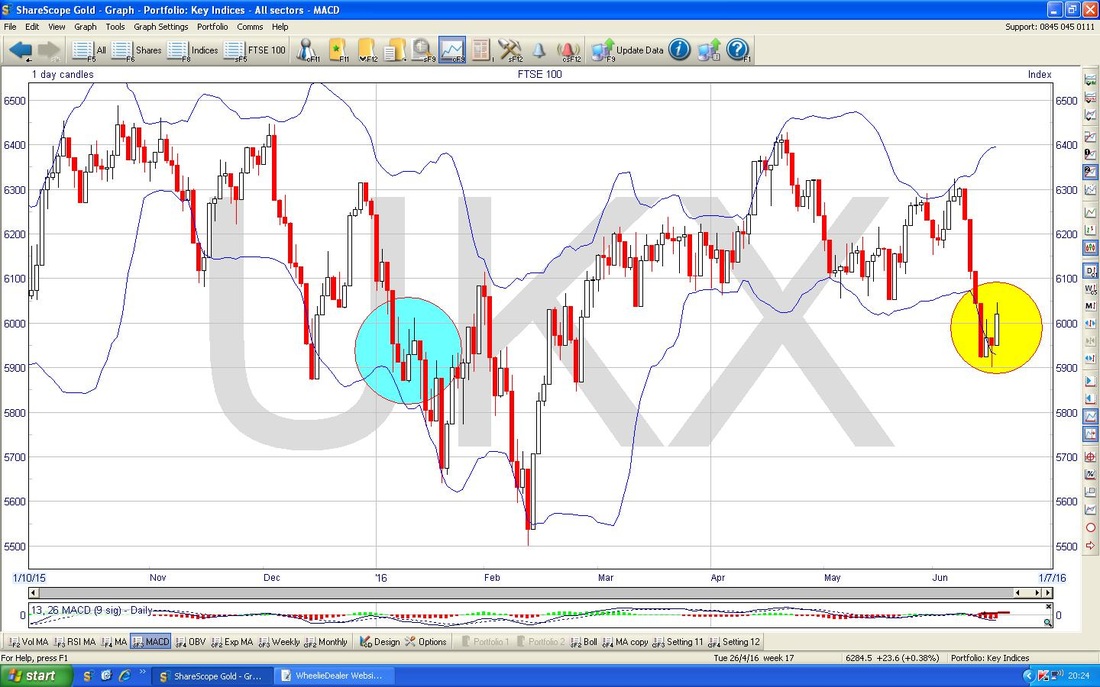
The Chart below contains some Hope for Bulls - I find the Weekly Candles have pretty good predictive powers and this one looks good - although of course any ‘Setup’ has a failure rate and nothing is 100% (or even close for that matter).
My Blue Arrow points to the Hammer Candle we got created last week - this looks Bullish in the context of 2 Down weeks before but a purist would probably argue that the ‘wide’ Body of the Candle is not so good - for a really Textbook Hammer we would need a much narrower Body and a proportionately huge ‘Tail’ pointing downwards. Make of it what you will, but clearly 5900 is a decent Support Level. 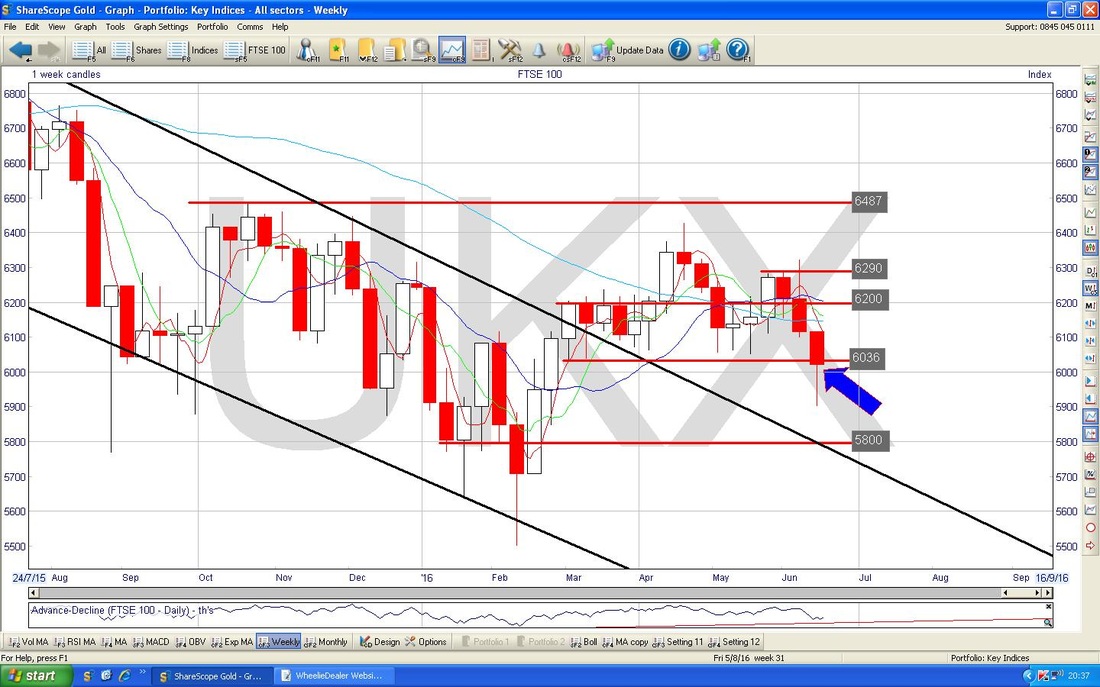
S&P500
First off let’s have a quick reminder of the Big Picture - here is the Chart for S&P500 over about 6 years - note the Resistance from my Blue Line at All Time Highs (marked with the Blue Arrow). Obviously it was pretty inevitable that this would be a difficult Level to get over (2135 is the ATH by the way). 
The Chart below zooms in on the Daily Candles for the S&P500 to cover just the last few Months. My Black Arrow is pointing to the Candle which was thrown up on Friday 17th June 2016 - this looks a bit negative to me, on two counts. Firstly, I think it looks like a ‘Dark Cloud Cover’ type 2-day Candle Pattern although the context for that is not great (ideally such a Pattern would need a good Run Up beforehand). Secondly, on Thursday 16th June 2016 we got a decent Hammer Candle and this was a pretty Bullish looking Setup for Friday - however, this total inability to build on this and ‘Follow Through’ is a bearish development I think.
Note my Support and Resistance Levels in the Boxes like with the FTSE100 Chart I showed earlier - my Blue Box with 2085 might act as Resistance this Week (or maybe even 2080 first off) and my Red Box with 2050 is a pretty key Support Level. If 2050 fails, then the next Support Levels are 2040, 2020, 2000, 1960 and a wide Band of Support from about 1950 down to 1810. Obviously I hope we don’t get anywhere near these kind of Levels, although I will probably still have some FTSE100 Shorts on so they would do rather well !! 
Brent Oil
Below is a Chart with the Daily Candles for Brent Crude Oil going back for most of 2016 so far. Regular Readers will probably recognise the Uptrend Channel marked with my Blue Parallel Lines. Note how the Price has fallen outside of this Channel - this could be a negative development. However, such Lines are subjective to a certain extent and it is possible that just by drawing the Bottom Line slightly differently, the Price would fall back within the Channel. Bearing this in mind, it is clearly not a great sign and we need to watch this in coming Days/Weeks. We need the Price to get back within my Uptrend Channel very quickly now or we have a problem - an ‘Overshoot’ is one thing but if the Price breaks out of the Bottom Line and then moves up only to fail and drop down again, then that would be a very Bearish ‘confirmation’ that things were weakening. We really need the Price to get back up over $50 at least to have hope we are not going to turn bearish - however, with the Brexit Vote this week, it won’t surprise me if Oil gets caught up in any sogginess as well. My Green Arrow points to a nice Up Candle from Friday - with the Brent Oil Price having dropped so much in recent Days, this looks a pretty bullish development - we shall see no doubt !! Note how the Price found Support at the 50 Day Moving Average. 
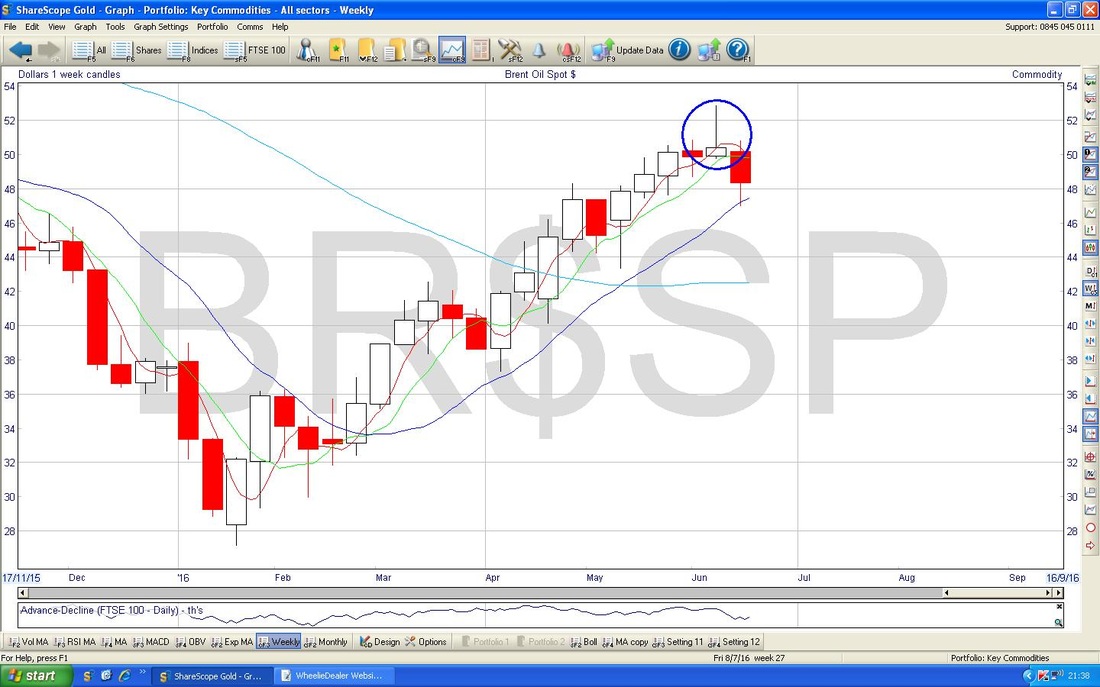
A quick recap here to show the ‘Power of Candles’ - this is the Weekly Chart for Brent Oil - note how the Bearish Inverted Hammer from last Week which is in my Blue Circle led to the move down this Week - I am pretty sure I showed this Inverted Hammer in my Blog last Sunday and it was bang on.
Gold
Not much to say on Gold really - it’s all about whether or not we can breakout over $1316 which was the Intraday High a couple of days ago. I note on my Fone that the ‘Gold Futures’ on CNBC are saying $1301 with a strong move up all day on Friday - so things are clearly pretty bullish looking. OK, that’s enough for tonight - I got an Isle of Wight Festival to watch and hear. Next week has the potential to be one of those Historic Weeks for the Markets - so make sure you keep your head and don’t panic into silly snap-decisions - that is the way to lose Money. Try to step back from the Emotions of it all and keep calm and objective - turn off CNBC and Bloomberg and all that and don’t keep looking at the Prices of your Shares. Like me, it might be best to look at things closely Out of Hours when the Markets have closed and try to make any Buy or Sell Decisions when you have calmed down and things are clear and you have Full Days of Price Information to go on - not just Intraday silly wiggles. No doubt I will be Tweeting and putting Updates on the Website - I wish everyone well for the Week ahead and I hope Readers can sail through any Storms in a Boat that doesn’t spring too many leaks. Top Luck !! WD. 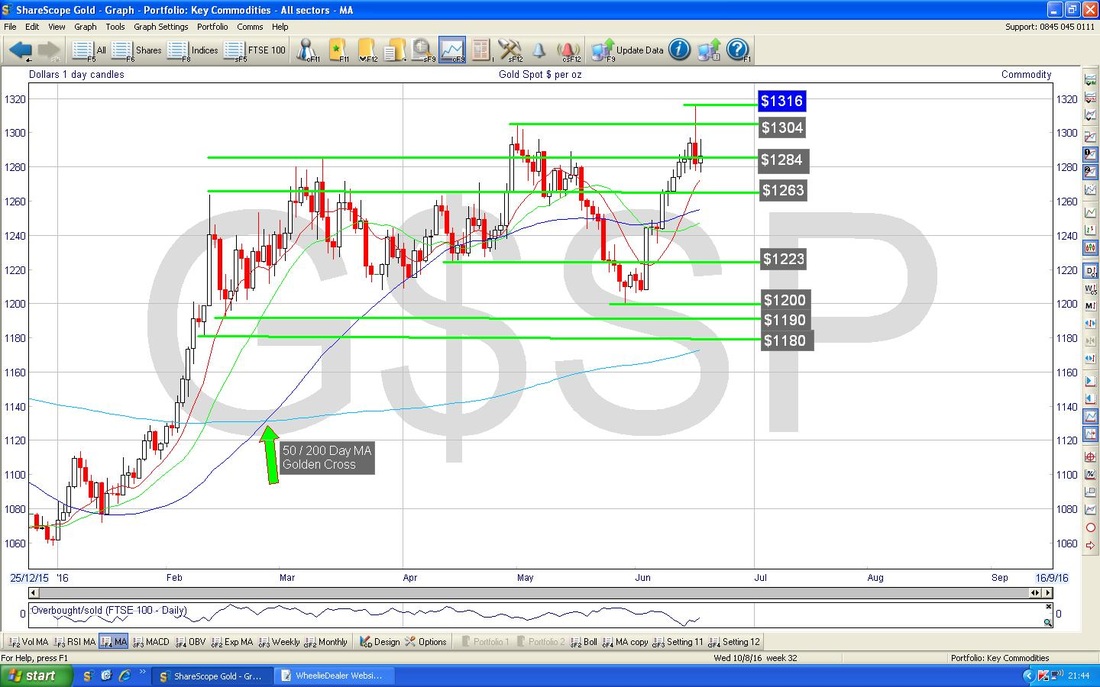
2 Comments
DavR0s
19/6/2016 12:22:11 pm
Interesting read again. Been giving this much thought over the weekend. Where I think I am headed is to remain largely hedged so end up with my equity holdings being about 60% hedged prior to vote. I am already 80% cash (so that would make me 90%+ cash equivalent) so I am prepared forgo any gains but keep protection as I have no idea where the market will go, and it's just a gamble (which I try and avoid). The last two big political events here - election and scots referendums both had initial rises followed by many 100point drops, so I am not sure any stayin vote will necessarily lead to sustained rises. We could see some major Tory fallout depspite this and they only have a slim majority.
WheelieDealer
20/6/2016 08:07:56 pm
Hi Dave, thanks for the feedback. I see the sense of your Hedging and Cash approach - interesting about the big drops after the recent Elections and with Autumn not far off, I can easily see this being repeated. I totally agree that playing this Brexit Vote is totally a gamble and there is no way I would want to be massively Long going into it - I think the chance of Brexit is hugely underestimated. My thoughts on removing the Shorts are similar - I would like a big drop so Brexit gets 'priced-in' - at the moment I don't think it is. Leave a Reply. |
'Educational' WheelieBlogsWelcome to my Educational Blog Page - I have another 'Stocks & Markets' Blog Page which you can access via a Button on the top of the Homepage. Archives
January 2021
Categories
All
Please see the Full Range of Book Ideas in Wheelie's Bookshop.
|
